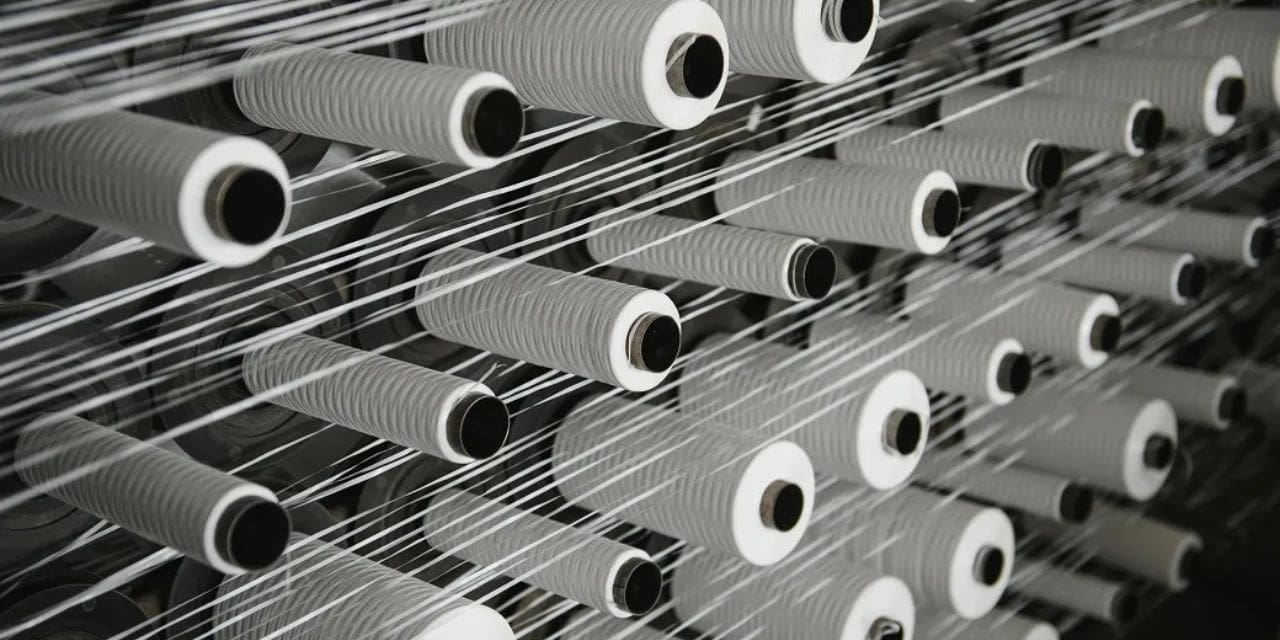
It’s no wonder that home textiles are a significant part of the global textile market. People have been able to invest more money in the home textiles segment due to their growing economic condition, which has been aided by several modern financial developments. As we move from west to east around the globe, per capita expenditure tends to decrease.
India has consolidated its position as the world’s second largest exporter of home textiles, after China, over the last few years. India is the largest exporter of home textiles as well as the largest consumer.
India has become a major supplier of a large variety of home textile products, such as linens and domestic products, to markets all over the world. The product range, which is traditionally created in contemporary designs, colours, and given with a hint of creativity, fascinates buyers of Indian home textile products.
India’s export potential for home textiles is increasing, and import penetration of home textiles into the US, UK, UAE and other markets is predicted to rise significantly.
Though, the Covid-19 pandemic has slowed down the home textile exports initially in 2020, India has witnessed a significant growth in the exports by the end of July, 2021.
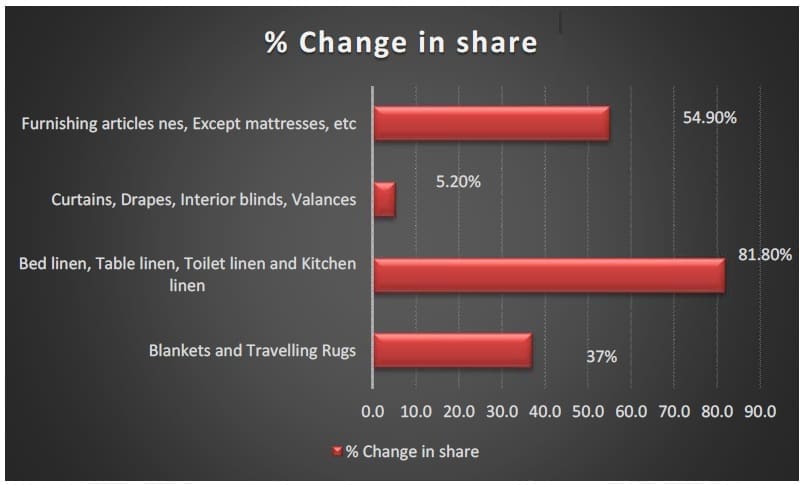
By July 2020, exports of Blankets and Travelling Rugs were worth around 79.01 million USD, which increased to 108.24 million USD by July, 2021. India exported Bed linen, Table linen, Toilet linen and Kitchen linen worth 1260 million dollars by the end of July, 2021, increasing its global share by 81.8%. Curtains, Drapes, Interior Blinds, and valances exports increased by only 5.20% to 89.35 million USD by July 2021, up from 84.94 million USD in 2020.Furnishing articles, nes, except mattresses, etc exports totalled $805.09 million at the end of July 2020, which climbed up to 1247.32 million dollars by July, 2021.
Exports of Blankets and Travelling Rugs
With imports of 9.33 million USD in June 2020 and 10.7 million USD in June 2021, the USA has remained the top importer of Blankets and Travelling Rugs since 2020.In July 2020, India exported products worth 0.43 million dollars, which grew to 0.5 million dollars in July 2021. India exported 1.83 million USD worth of blankets and Travelling Rugs to Australia by the end of July, 2020, which declined by 4.9% to 1.74 million USD by July, 2021. China, Canada, and Sweden imported products worth around 1.7 million. The UAE’s global share increased by 13% with imports of 1.56 million dollars during the period from January to July of 2021.
Exports of Bed linen, Table linen, Toilet linen and Kitchen linen
In both years, the USA took the lead with imports of Bed linen, Table linen, Toilet linen and Kitchen linen totalling 443.12 million USD and 877.15 million USD, respectively. Imports of China have increased by 97.95%. By July 2021, India supplied Canada with Bed linen, Table linen, Toilet linen and Kitchen linen valued at 877.15 million USD. Germany’s imports were worth $24.4 billion at the end of 2020, rising to $38.93 million by July 2021. By July 2021, the UK and Australia will have imported products worth 36.33 and 34.58 million dollars, increasing their global share by 23.32% and 73.86%, respectively. The UAE’s imports were worth 11.16 million USD as of July, 2020, which gradually hiked at the end of July, 2021, to 16.65 million USD. By July 2021, imports from the rest of the world increased by 39%.
Exports of Curtains, Drapes, Interior blinds, Valances
With exports worth 26.93 million USD in 2020 and 46.51 million USD in 2021, the USA remained in the first position in both years, increasing its share of imports by 72.71%. As of July 2021, India’s exports to France and Germany were $6.24 and $5.56 million. On the other hand, exports of Curtains, Drapes, Interior blinds, and valances to the UAE dropped significantly by 85.51%, from 38.37 million USD in the year 2020 to 5.56 million USD by the end of July, 2021. In 2021, China imported 1.41 million USD worth of Curtains, Drapes, Interior blinds, Valances. From January to July 2021, India’s overall exports of these products climbed by just 5.2%.
Exports of furnishing articles, except mattresses, etc.
India exported Furnishing articles, nes, except mattresses, valued at 455.57 million dollars by July 2020 to the USA, which climbed up to 724.39 million dollars at the end of July, 2021. The USA’s global share of the imports of these products is 58.08%. The UK and Germany imported products worth 61.72 and 43.49 million dollars by July 31st, 2021, taking their global share to 4.95 and 3.49% respectively. Both Canada and Australia’s global share increased by approximately 94% with imports worth 39.12 and 37.08 million USD in the corresponding period of 2021. By the end of July 2021, the UAE and Spain will have imported furnishing articles, nes, except mattresses, valued at around 21 million USD. Total imports from other countries were worth 235.84 million USD by the end of July, 2021, which was far less than the USA’s total imports.
| Blankets and Travelling Rugs | ||||||
| Country | July 2020 | July 2021 | Jan – July 2020 |
Jan – July 2021 |
% Change | % Share in Total Exports |
| USA | 9.33 | 10.79 | 50.40 | 69.99 | 38.9 | 64.66 |
| Germany | 0.66 | 0.47 | 2.82 | 4.11 | 45.7 | 3.80 |
| UK | 0.43 | 0.50 | 2.09 | 3.16 | 51.2 | 2.92 |
| Nepal | 0.05 | 0.14 | 0.52 | 1.76 | 238.5 | 1.63 |
| Australia | 0.27 | 0.25 | 1.83 | 1.74 | -4.9 | 1.61 |
| China | 0.20 | 0.08 | 1.23 | 1.69 | 37.4 | 1.56 |
| Canada | 0.28 | 0.37 | 1.22 | 1.64 | 34.4 | 1.52 |
| Sweden | 0.07 | 0.17 | 0.62 | 1.63 | 162.9 | 1.51 |
| UAE | 0.27 | 0.19 | 1.38 | 1.56 | 13.0 | 1.44 |
| Poland | 0.18 | 0.17 | 0.58 | 1.37 | 136.2 | 1.27 |
| Others | 3.34 | 3.03 | 16.31 | 19.50 | 19.6 | 18.02 |
| Total | 15.13 | 16.18 | 79.01 | 108.24 | 37.0 | 100.00 |
| Bed linen, Table linen, Toilet linen and Kitchen linen | ||||||
| Country | July 2020 | July 2021 | Jan – July 2020 |
Jan – July 2021 |
% Change | % Share in Total Exports |
| USA | 82.09 | 160.83 | 443.12 | 877.15 | 97.95 | 69.62 |
| Canada | 3.54 | 8.09 | 21.77 | 43.64 | 100.46 | 3.46 |
| Germany | 4.69 | 6.59 | 24.4 | 38.93 | 59.55 | 3.09 |
| UK | 4.18 | 5.76 | 29.46 | 36.33 | 23.32 | 2.88 |
| Australia | 4.62 | 5.34 | 19.89 | 34.58 | 73.86 | 2.74 |
| Netherlands | 2.61 | 3.03 | 17.63 | 22.81 | 29.38 | 1.81 |
| Israel | 2.27 | 3.97 | 9.22 | 18.7 | 102.82 | 1.48 |
| France | 1.81 | 2.2 | 8.39 | 17.58 | 109.54 | 1.40 |
| UAE | 1.97 | 2.96 | 11.16 | 16.65 | 49.19 | 1.32 |
| Poland | 1.27 | 1.78 | 5.52 | 11.28 | 104.3 | 0.90 |
| Others | 20.65 | 25.48 | 102.36 | 142.26 | 39.0 | 11.29 |
| Total | 129.81 | 226.08 | 693.00 | 1,260.00 | 81.8 | 100.00 |
| Curtains, Drapes, Interior blinds, Valances | ||||||
| Country | July 2020 | July 2021 | Jan – July 2020 |
Jan – July 2021 |
% Change | % Share in Total Exports |
| USA | 6.17 | 8.09 | 26.93 | 46.51 | 72.71 | 52.05 |
| France | 0.56 | 1.05 | 3.36 | 6.24 | 85.71 | 6.98 |
| Germany | 0.47 | 0.86 | 2.77 | 5.56 | 100.72 | 6.22 |
| UAE | 5.19 | 0.56 | 38.37 | 5.56 | -85.51 | 6.22 |
| Sweden | 0.4 | 1.02 | 1.49 | 3.49 | 134.23 | 3.91 |
| Japan | 0.31 | 0.26 | 1.69 | 2.42 | 43.20 | 2.71 |
| UK | 0.24 | 0.36 | 1.02 | 2.27 | 122.55 | 2.54 |
| Canada | 0.15 | 0.31 | 0.85 | 1.84 | 116.47 | 2.06 |
| China | 0.13 | 0.16 | 1.06 | 1.41 | 33.02 | 1.58 |
| Saudi Arabia | 0.08 | 0.27 | 0.40 | 1.39 | 247.5 | 1.56 |
| Others | 1.92 | 2.12 | 6.95 | 12.62 | 81.6 | 14.12 |
| Total | 15.65 | 15.09 | 84.94 | 89.35 | 5.2 | 100.00 |
| Furnishing articles nes, Except mattresses, etc | ||||||
| Country | July 2020 | July 2021 | Jan – July 2020 |
Jan – July 2021 |
% Change | % Share in Total Exports |
| USA | 110.56 | 110.68 | 455.57 | 724.39 | 59.01 | 58.08 |
| UK | 7.45 | 10.1 | 34.79 | 61.72 | 77.41 | 4.95 |
| Germany | 7.98 | 6.76 | 34.72 | 43.49 | 25.26 | 3.49 |
| Canada | 4.9 | 7.66 | 20.13 | 39.12 | 94.34 | 3.14 |
| Australia | 3.92 | 5.35 | 19.1 | 37.08 | 94.14 | 2.97 |
| France | 3.59 | 5.46 | 18.51 | 29.43 | 59.00 | 2.36 |
| UAE | 2.17 | 3.71 | 13.96 | 21.1 | 51.15 | 1.69 |
| Spain | 2.61 | 3.91 | 16.75 | 20.58 | 22.87 | 1.65 |
| Italy | 2.56 | 2.45 | 14.92 | 18.79 | 25.94 | 1.51 |
| Sweden | 1.75 | 2.69 | 7.97 | 15.66 | 96.5 | 1.26 |
| Others | 32.09 | 38.73 | 168.60 | 235.84 | 39.9 | 18.91 |
| Total | 179.62 | 197.51 | 805.09 | 1,247.32 | 54.9 | 100.00 |
Data Source: Ministry of Commerce and Industry
By
Somasree Roy
Textile Value Chain