Hengli Petrochemical
Executive Summary
Hengli Petrochemical is one of the key companies in the manufacture of integrated petrochemical products and polyester fibers in China. The company was founded in 1994 and has been operating in the entire value chain from refining to petrochemical and new materials. According to the financial statements, despite a fall in income in FY2025 due to reduced product prices and an unfavorable market environment, the firm managed to increase its gross profit and EBITDA and maintain its net profit.
Company Overview

Hengli Petrochemical is a massive Chinese company. It was founded by Chen Jianhua and Fan Hongwei. They started the business in 1994 as a small textile factory. It has since grown into a massive global oil refining and chemical company. It is a publicly traded company listed on the Shanghai Stock Exchange.
Industry Overview
The company operates in a petrochemicals and polyester industry that focuses on providing raw materials to other manufacturing industries that include textiles, packaging, automotive, construction, and consumer goods, among others. The company also faces several challenges that include fluctuating oil prices, a supply-demand gap problem in polyester, and high competition in the industry. However, despite all these, the industry is still expanding owing to innovations and integration of production processes and due to increasing demands for value-added materials by electric vehicles and renewable energy industries.
Financial Performance Analysis
Particulars (Billion Yuan) | 2025 | 2024 |
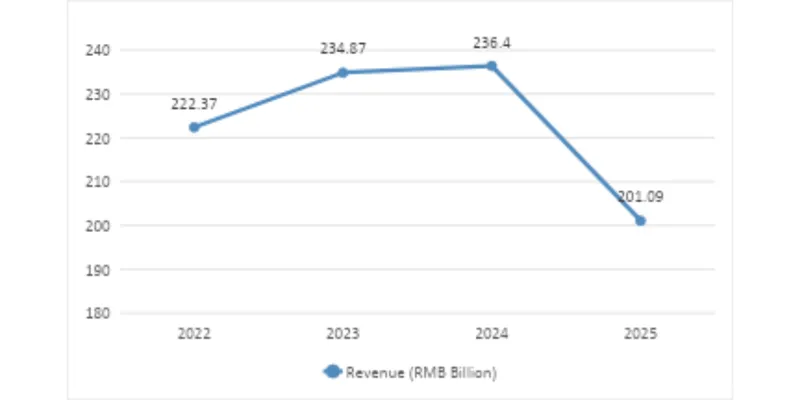
Revenue | 201.09 | 236.4 |
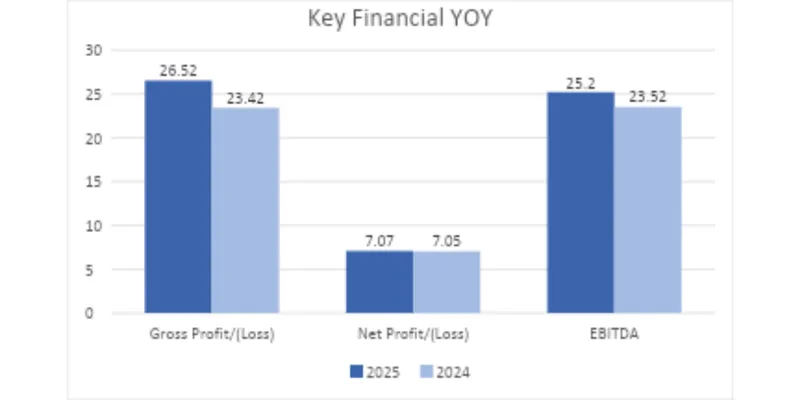
Gross Profit/(Loss) | 26.52 | 23.42 |
Net Profit/(Loss) | 7.07 | 7.05 |
EBITDA | 25.2 | 23.52 |
4.1 Key Financial YOY
4.2 Revenue Trend Over 3-5 Years
4.3 Interpretation
The reason for revenue decline was low prices of products as well as tough market conditions within the industry. Although there was a decline in revenues, gross profit was higher, which proves that the company is highly efficient in producing products, managing costs, and product mix. The net profit is steady; it shows the ability of the company to generate profit. The company also showed a good performance in terms of EBITDA.
Key Financial Ratio
Ratio | Formula | 2025 | Brief Interpretation |
Current Ratio | Current Assets / Current Liabilities | 0.56 | The company has ₹0.56 of current assets for every ₹1 of current liabilities, indicating relatively low short-term liquidity. |
Quick Ratio | (Current Assets − Inventory) / Current Liabilities | 0.37 | The company has ₹0.37 of liquid assets to cover every ₹1 of current liabilities, showing dependence on inventory for meeting short-term obligations. |
Gross Margin | Gross Profit / Revenue × 100 | 13.19% | The company earned a 13.19% gross profit on every ₹100 of revenue, reflecting improved production efficiency and cost control. |
Net Profit Margin | Net Profit / Revenue × 100 | 3.52% | The company generated ₹3.52 net profit from every ₹100 of revenue, indicating stable profitability. |
Return on Equity (ROE) | Net Profit / Shareholders' Equity × 100 | 10.59% | The company generated a 10.59% return on shareholders' investment, showing efficient use of equity. |
Debt-to-Equity Ratio | Total Debt / Shareholders' Equity | 1.97 | The company has ₹1.97 of debt for every ₹1 of equity, indicating relatively high financial leverage. |
Interest Coverage Ratio | EBIT / Interest Expense | 2.78× | The company earned 2.78 times its interest expense, indicating an adequate ability to meet interest obligations. |
Inventory Turnover | Cost of Operations / Average Inventory | 7.21× | Inventory was sold and replaced 7.21 times during the year, indicating efficient inventory management. |
Asset Turnover | Revenue / Average Total Assets | 0.75× | The company generated ₹0.75 of revenue for every ₹1 invested in assets, reflecting moderate asset utilization. |
SWOT Analysis
Strengths | Weaknesses |
Strong integrated petrochemical and polyester value chain, providing cost advantages. | High debt levels increase financial leverage. |
Large-scale production capacity with a diversified product portfolio. | Revenue is sensitive to fluctuations in crude oil and petrochemical prices. |
Strong R&D capabilities and focus on high-value specialty materials. | Current and quick ratios indicate relatively weak short-term liquidity. |
Opportunities | Threats |
Rising demand from electric cars, renewables, and sophisticated materials. | Fluctuating crude oil prices and rising cost of raw materials. |
Increased demand for eco-friendly and premium chemicals. | High competition and overcapacity in the industry could hurt profit margins. |
Expansion via technological advancement and environmentally-friendly production. | Geopolitical tensions and environmental regulation changes could impact business. |
Conclusion and Recommendations
Analysis indicates that the income of Hengli Petrochemical decreased in FY2025 due to reduced prices and an unfavorable market situation. Nevertheless, the firm succeeded in increasing gross margin and EBITDA while sustaining the net income level through efficient cost management. The integrated manufacturing system, innovative research & development capacity, and production of premium specialty materials are the fundamental bases for further growth of the company.
References & Sources
- Hengli Petrochemical Annual Report 2025
- Hengli Petrochemical Official Website
- Microsoft Excel (Charts and Ratio Analysis)