GARWARE MARINE INDUSTRIES
- INTRODUCTION
- Introduction of the company
Garware Marine Industries Limited (GMIL) has evolved from its mid-20th-century roots in industrial manufacturing to become a specialised service provider in the Indian maritime landscape.
- Industry Overview
- The maritime and industrial textile sector is a critical cog in India’s industrial wheel.
- With about 2 per cent of India’s overall GDP coming from textiles, this sector also accounts for nearly 11 per cent of gross value added in manufacturing.
- Positioned along key maritime pathways, the country finds advantage in ship repairs - a field eyed for expansion amid a worldwide market worth several billion annually.
- Purpose of the Analysis
- This assessment examines how Garware Marine fared financially and operationally, focusing on its return to profit alongside a shift toward a leaner asset model.
2. COMPANY OVERVIEW
- Background and History
Founded in 1975 as Modern Nets Limited, the company was once a leader in nylon fishing net production. In 1981, it was renamed Garware Marine Industries. Following a strategic shift in 2013, the company ceased its primary manufacturing operations to focus on specialized marine engineering services.
- Business Model
- With a lean setup, GMIL runs without heavy physical assets. Instead of building large factories, it delivers specialised services through its Ship Repair Division. Technical workers handle maintenance tasks onboard vessels. Expertise in marine engineering allows the team to fix complex issues efficiently. This way, expenses tied to big industrial spaces are left behind. Operating simply keeps overhead low while staying effective.
- Key Products / Services
Core services include engine overhauls, pump repairs, hydraulic system servicing, and specialised marine fabrication. They often assist OEM engineers during complex dry-docking operations.
- Market Position
A tiny firm, GMIL trades at about ₹14–15 crore in market value. Instead of battling giants in the industry, it finds room by focusing on select private shipping clients. Working behind the scenes, it often steps in as a technical partner for bigger projects.
3.PROMOTER /FOUNDER INFORMATION
Name of Promoter | Professional Background | Role in Company Growth |
|---|---|---|
Late Dr. B.D. Garware | Padmabhushan awardee; founded the Garware Group of companies. | Visionary who established the industrial foundation and brand equity. |
Mr. Aditya A. Garware | Experienced industrialist with decades of leadership in the marine and offshore sectors. | The chairman navigated the transition from manufacturing to technical services. |
Mr. S.V. Atre | Professional with deep technical expertise in marine engineering. | Executive Director; manages the day-to-day operations of the Ship Repair Division. |
4. FINANCIAL STATEMENT ANALYSIS
- Income Statement Analysis
Particulars | FY 2023 | FY 2024 | FY 2025 |
|---|---|---|---|
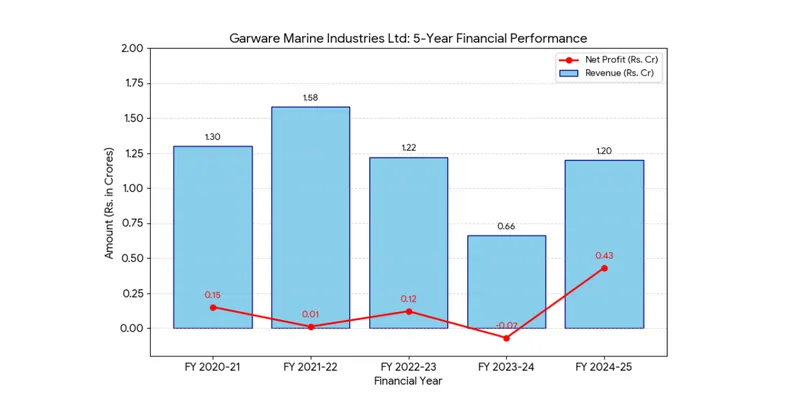
Total Revenue | 1.22 | 0.71 | 1.20 |
Total Expenses | 1.10 | 0.78 | 0.77 |
Net Profit / (Loss) | 0.12 | (0.07) | 0.43 |
Interpretation:
- Profit Turnaround: The company successfully reversed a loss from FY24, achieving its highest net profit in recent years during FY25.
- Revenue Growth: Revenue saw a significant 69% increase year-on-year, primarily driven by a major dry-docking project from a primary customer.
- Expense Control: Despite the revenue jump, total expenses remained stable at ₹0.77 Cr, leading to high operating leverage and improved margins.
- Revenue Chart
- Balance Sheet Analysis (Rs. In crore)
Assets (FY 2025) | Amount | Liabilities & Equity (FY 2025) | Amount |
|---|---|---|---|
Non-Current Assets | 12.74 | Shareholders' Equity | 17.96 |
Current Assets | 6.43 | Non-Current Liabilities | 0.00 |
Other Assets/Cash | 0.02 | Current Liabilities | 1.21 |
Total Assets | 19.17 | Total Equity & Liabilities | 19.17 |
- Solvency: The company is virtually debt-free, with zero long-term borrowings, representing a very safe financial structure.
- Asset Composition: A significant portion of assets is tied up in long-term investments rather than physical plant and machinery, consistent with their service model.
- Liquidity: Current assets comfortably cover current liabilities, showing no immediate risk of a liquidity crunch.
- Cash Flow Statement Analysis (Rs. In crore)
Particulars | Amount (₹ Cr) |
|---|---|
Cash from Operating Activities | 0.34 |
Cash from Investing Activities | (0.01) |
Cash from Financing Activities | 0.00 |
Interpretation:
- Core Cash Generation: For the first time in several cycles, the company generated positive cash flow from operations (₹0.34 Cr).
- Low Reinvestment: The minimal spending in investing activities indicates the company is not currently expanding its physical infrastructure.
- Key Financial Ratios
Ratio | Value | Interpretation |
|---|---|---|
ROE (Return on Equity) | 2.40% | Modest efficiency in utilizing shareholder funds. |
Current Ratio | 5.31 | Exceptionally high liquidity; well above the industry standard. |
Debt to Equity | 0.00 | Ideal leverage position; no interest burden. |
Operating Margin | 35.83% | Healthy margins on the service contracts executed during the year. |
- Year-on-Year Comparison (3 years)
Particulars (Rs. in Crores) | FY 2022-23 | FY 2023-24 | FY 2024-25 | Key YoY Interpretation |
|---|---|---|---|---|
Total Revenue | 1.22 | 0.66 | 1.20 | Recovery: Revenue surged by 81% YoY in FY25, rebounding from a weak FY24 after securing a major dry-docking project. |
Operating Profit | 0.12 | (0.11) | 0.43 | Efficiency: Moved from a loss to a 36% operating margin; expenses remained flat despite the revenue jump. |
Net Profit / (Loss) | 0.12 | (0.07) | 0.43 | Turnaround: FY25 marks a 3-year high in profitability, successfully reversing the marginal net loss of the previous year. |
Total Assets | 8.10 | 11.49 | 19.17 | Value Growth: Assets nearly doubled in FY25, primarily driven by the appreciation of long-term listed investments. |
Total Debt | 0.00 | 0.00 | 0.00 | Solvency: Maintained a strictly Debt-Free status for the entire 3-year period, eliminating all interest-rate risks. |
Net Worth | 7.91 | 11.05 | 17.95 | Stability: Net worth grew by 62% in the last year alone, reflecting strong retained earnings and improved book value. |
5. KEY INSIGHTS & INTERPRETATION
- Strengths
Zero debt, high liquidity, and strong backing from the Garware brand name.
- Weaknesses
Extremely small scale of operations and high "debtor days" (collection cycles), which can strain working capital
- Risk Factors
- High concentration risk; a large portion of revenue often comes from a single major client or vessel repair project.
- Future Outlook
The outlook is cautiously positive if they can leverage their debt-free status to bid for larger maritime maintenance contracts or diversify into consultancy.
6. CONCLUSION
Final Evaluation of Financial Health
Garware Marine Textiles (Industries) is currently in a "stabilization" phase. Its financial health is robust due to a lack of debt and high liquid assets, but its performance is highly sensitive to the timing of ship repair contracts.
Investment / Performance Perspective
From an investment perspective, it is a low-risk but low-growth stock that currently trades near its book value, reflecting its limited operational scale.
Data Sources
https://www.screener.in/company/509563/
https://www.tijorifinance.com/company/garware-marine-industries-ltd/financials/
https://share.google/my5nHMAIgNcpbamVs
https://share.google/2jveiWEe0EUtkNRTi