Financial Analysis Report Tirupati Foam Limited

1. Introduction
Tirupati Foam Limited operates out of Gujarat, making soft polyurethane foam items. This firm trades its shares on two Indian exchanges - BSE under code 540904, also found on NSE as TIRUFOAM.
Starting out in 1986, the company set up a base in Ahmedabad. Its main presence grows from a well-known name - Sweet Dream. This label reaches people's homes along with serving larger business needs. Operations stretch across different customer types without losing focus.
City life is on the rise, so more people can afford better bedding choices. As incomes climb, interest in restful sleep spreads fast across towns. Branded foam items get picked more often now - quality matters louder than before.
Oil-driven chemicals like TDI and polyol shape how much PU foam costs, since their prices swing with worldwide markets. Though tied to fossil fuels, these materials set the rhythm for pricing across the entire foam sector. When crude trends shift, so does spending on production inputs.
2. Company Overview
A name change came first - Tirupati Foams Pvt Ltd shifted into something broader. That earlier version, once called Tirupati Foam Pvt Ltd too, eventually unfolded beyond private walls. Transformation followed, stepping slowly toward public structure.
A fresh chapter opened when the business moved into making everyday comfort items, tagged with the name Sweet Dream. Success came quietly through approval by ISI standards, marking its reliability without fanfare.
A factory run by TFL sits in Ahmedabad, while a newer site in Noida handles demand from the north. Expanding there helped meet rising needs beyond the original location.
Branded goods hit shelves through Sweet Dream and Mr. Back, offering sleep-focused items like mattresses and pillows. From cushions to yoga mats, each product carries a label meant to stick. Bolsters join the lineup, rounding out a collection built around comfort. Instead of blending in, these pieces aim to stand apart on crowded racks. Labels matter here, shaping how customers see every item they meet.
3. Promoter / Founder Introduction
Mr. Veni Purohit – Chairman & Non-Executive Director
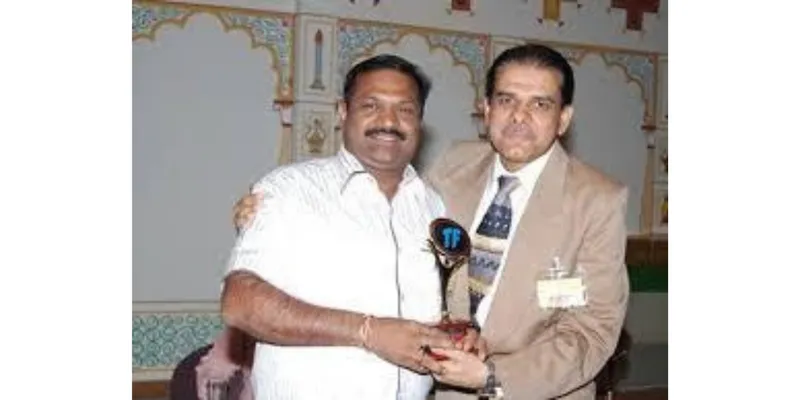
With four decades under his belt, he’s navigated leadership roles across shifting markets. Years shaped by real moves, not just plans. Steering companies through change became second nature along the way.
From the start, this person has shaped how things move forward over time. Their presence helped set a steady course when paths weren’t clear yet. Years passed, but their influence stayed woven into decisions made quietly behind the scenes. Direction came not in bursts, but through small shifts guided by experience. Early choices still echo because consistency wasn’t forced - it grew.
Roshan P. Sanghavi runs things full time. Over three decades shaped his path through law, outreach work, and management tasks. His presence fills operational spaces quietly. Legal groundwork came first. Marketing followed much later. Admin duties tied it together. Years stacked up without fanfare. Leadership grew out of doing, not claiming.
A big part of the company’s ownership sits with the promoter group - about 72.14 percent - keeping leadership grounded and responsible. Four decades of hands-on know-how from the founders? That shapes how they stay ahead.
4. Financial Statement Analysis
4.1 Income Statement Analysis
Particulars | FY2023 (₹ Cr) | FY2024 (₹ Cr) | FY2025 (₹ Cr) |
|---|---|---|---|
Revenue from Operations | 101.65 | 103.99 | 106.03 |
Total Expenses | 92.37 | 94.99 | 97.85 |
Operating Profit (EBITDA) | 9.28 | 9.00 | 8.18 |
OPM % | 9.13% | 8.65% | 7.71% |
Interest Cost | 4.82 | 4.77 | 4.19 |
Depreciation | 2.26 | 2.01 | 1.67 |
Profit Before Tax | 2.64 | 2.76 | 2.82 |
Net Profit | 1.90 | 2.10 | 2.14 |
EPS (₹) | 4.31 | 4.77 | 4.86 |
Key Observations:
The jump from ₹101.65 Cr to ₹106.03 Cr unfolded without sudden spikes. Over three years, gains added up consistently but slowly. This pattern results in just under a 2.1% average annual climb.
A small climb marks the story here - net profit moves up, stepping from ₹1.90 Cr to ₹2.14 Cr during those months. Though quiet in pace, the rise holds steady, shaped by fewer dips and tighter control.
Still, profits dipped a touch - from 9.13% down to 7.71% - probably due to pricier materials eating into returns. Though small, the shift hints at tighter spending control needs lately.
4.2 Balance Sheet Analysis
Particulars | FY2023 (₹ Cr) | FY2024 (₹ Cr) | FY2025 (₹ Cr) |
|---|---|---|---|
Equity Capital | 4.44 | 4.44 | 4.44 |
Reserves & Surplus | 24.66 | 26.34 | 28.05 |
Total Borrowings | 46.55 | 40.40 | 39.54 |
Other Liabilities | 11.67 | 14.08 | 15.72 |
Total Liabilities | 87.32 | 85.26 | 87.75 |
Fixed Assets (Net) | 38.58 | 36.64 | 34.42 |
Other Assets (Current) | 48.73 | 48.61 | 53.33 |
Total Assets | 87.32 | 85.26 | 87.75 |
Key Observations:
A drop in borrowings shows up - moving from ₹46.55 Cr to ₹39.54 Cr - hinting that handling debt might be getting tighter. Though lower numbers usually suggest caution, here they point toward control instead.
Fresh funds tucked into reserves climbed from ₹24.66 Cr up to ₹28.05 Cr, showing what stayed after payouts. Profits kept inside the business built that rise, step by step.
Over time, fixed assets shrank. This happened because depreciation kept cutting value while new investment stayed flat. Growth potential looks tight under these conditions.
4.3 Cash Flow Statement Analysis
Particulars | FY2023 (₹ Cr) | FY2024 (₹ Cr) | FY2025 (₹ Cr) |
|---|---|---|---|
Cash from Operations (CFO) | 5.27 | 9.01 | 6.27 |
Cash from Investing (CFI) | -0.61 | 0.13 | 1.23 |
Cash from Financing (CFF) | -4.38 | -11.36 | -5.49 |
Net Cash Flow | 0.28 | -2.22 | 2.01 |
Free Cash Flow | 4.26 | 8.93 | 6.08 |
Key Observations:
Built on steady production, cash keeps flowing month after month. It’s what lets factories stay grounded when markets shift. Profit isn’t just promised here - it shows up, counted and real. Stability doesn’t shout; it arrives quietly in ledgers. A working machine makes more than goods - it builds trust through repetition.
Fresh money coming in stays strong, handling payouts to shareholders while chipping away at what's owed.
Pay down loans show up here, slowly making the financial position more solid. Over months, owing less builds a steadier foundation beneath everything else.
4.4 Key Financial Ratios
Ratio | FY2023 | FY2024 | FY2025 |
|---|---|---|---|
ROCE (%) | 10.02% | 10.26% | 9.54% |
ROE (%) | 6.6% | 7.1% | 6.35% |
OPM (%) | 9.13% | 8.65% | 7.71% |
Debtor Days | 72.9 | 62.8 | 64.7 |
Inventory Days | 106.8 | 123.9 | 132.9 |
Cash Conversion Cycle | 133 | 132 | 134 |
P/E Ratio (Current) | - | - | ~15.7x |
P/B Ratio (Current) | - | - | 0.96x |
Dividend Payout % | 0.00% | 21.14% | 20.75% |
5. Key Insights & Interpretation
5.1 Strengths
Ownership at 72.14 percent shows promoter confidence - stability often follows when stakes are this high. Fewer shifts happen behind the scenes if those who built it still hold tight.
Starting strong - cash from operations stays reliably above zero. That steady stream backs both dividend payments and paying down loans at the same time. Free cash flow remains solid, giving room to manage obligations without strain. Money coming in outpaces outgoing needs, creating a buffer. This balance allows flexibility, quietly strengthening financial footing.
5.2 Weaknesses
Revenue inches ahead by just 2% each year on average - this stretch has trailed most rivals plus economic gains overall, hinting at stalled reach within the marketplace.
Margins got smaller - dropped from 9.13% in FY2023 down to 7.71% by FY2025. Pressure built up on costs while prices stayed tight, dragging results lower. Profit space narrowed even though nothing big changed elsewhere.
5.3 Risk Factors
Starting off, TDI plus polyol move up and down alongside oil markets since they stem from petrochemical sources. These materials directly impact how much it costs to make PU foam worldwide. Prices shift fast when crude rates change. That jolt travels straight into manufacturing budgets. What happens overseas shows up in local expenses almost immediately.
A tight cushion on interest costs signals risk when rates climb. Not much room to absorb higher borrowing expenses shows up in the numbers. Rising rates could pinch this firm more than others nearby. Weakness here stands out when comparing to safer financial profiles.
5.4 Future Outlook
A fresh push into northern India might come from expanding the Noida plant - better shipping efficiency sits on the horizon. Instead of delays, quicker access takes shape through local production shifts. Movement in supply routes emerges where infrastructure once slowed progress. Growth isn’t just size, it’s reach, reshaped by location choices. Distance shrinks when factories align closer to demand centers. What was once a bottleneck now bends toward flexibility.
Over the coming two to three years, paying down debt keeps going. Interest costs drop because of it. Lower expenses help profits grow bit by bit. Each dollar saved on interest adds room below the top line. Net margins respond slowly but surely.
6. Conclusion
A company that has kept going without missing a beat - Tirupati Foam Limited runs on steady earnings after thirty-nine years making PU foam across India. Profits show up year after year, promoters stand firmly behind it, while shrinking debts quietly signal careful money habits. Financial balance isn’t claimed here - it simply adds up.
A steady path marks TFL's appeal - ideal for those focused on income rather than quick gains. Stability matters more than speed here. Should earnings begin rising faster, that could shift how the market sees it. So might be an improvement in profit margins. Long-term holders find footing when predictability anchors returns
Data Sources Screener dot in BSE India BSE 540904 Tirupati Foam Official Website tirupatifoam dot com Zerodha Markets Business Standard MCA Company Registry