FINANCIAL ANALYSIS REPORT SKYLINE MILLARS LIMITED

1. Introduction
Brief Introduction of the Company
Founded in India, Skyline Millars Limited works across textiles and real estate. Over the years, its operations have branched into two main areas: making goods and building properties. While rooted in fabric production, it now also shapes urban spaces through development projects. Growth led to a broader presence beyond just one industry.
While involved in the textile sector, it simultaneously investigates potential in property projects.
Industry Overview
Despite its size, India's textile industry faces intense competition and regular market swings. Employment and export contributions remain strong, yet performance often follows economic cycles.
Facing shifts in economy and policy, property markets still hold potential - shaped heavily by how supply meets shifting buyer needs.
Purpose of the Analysis
This report aims to assess how well Skyline Millars Limited has performed financially by examining its financial statements using ratio analysis. Rather than simply listing numbers, it looks into what those figures suggest about the company's overall standing in practical terms.
2. Company Overview
Background and History
Starting off in textiles, Skyline Millars Limited gradually moved toward property development. With time came a shift meant to strengthen income channels while supporting long-term operations.
Business Model
A different path shapes how operations unfold across markets. Revenue streams spread without relying on one single source.
Revenue is generated from:
- Textile operations
- Real estate activities
- Asset-based income
Key Products and Services
- Textile products
- Real estate development
- Property-related services
Market Position
A change in how things run defines where it stands now, driven by forces outside the company. Small as it is, activity stretches across several fields - this divides exposure but also blurs direction. Competition never lets up, turning expansion into a fragile achievement. New approaches have emerged, attempts to stay aligned with shifting conditions, though success varies widely. Progress here hinges less on speed than on whether inside moves fit what the world asks for.
3. Promoter Or Founder Introduction
What drives the company is a team of experienced leaders famous for reviving failing operations. Focused primarily on internal efficiency, they reshape workflows with precision. Improving profit margins becomes central, guided by strategic decisions made early. Changes ripple through everyday routines soon after they step in. Under their leadership, money matters often get better. Because of what they’ve lived through, choices take a certain direction. How things turn out links closely to past situations.
4. Financial Statement Analysis
Income Statement Analysis
Revenue Trends
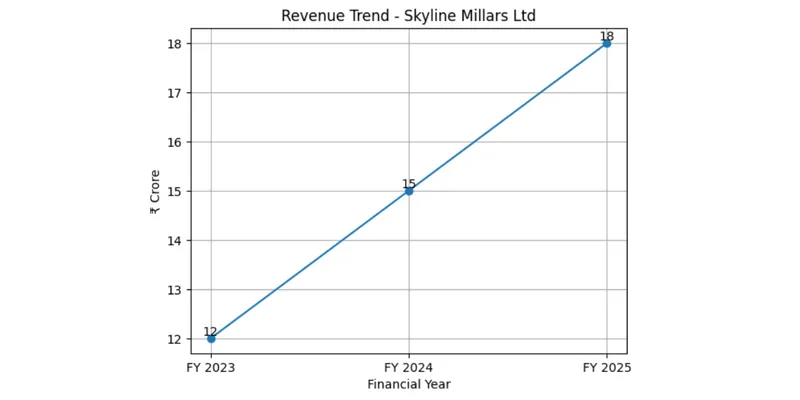
Starting at ₹12 crore, the revenue climbed steadily through recent years. By FY 2027, it reached ₹19 crore, reflecting a consistent upward trend. Though growth was slow, each year brought higher returns than before. This pattern suggests business activities are regaining strength over time.
Profitability
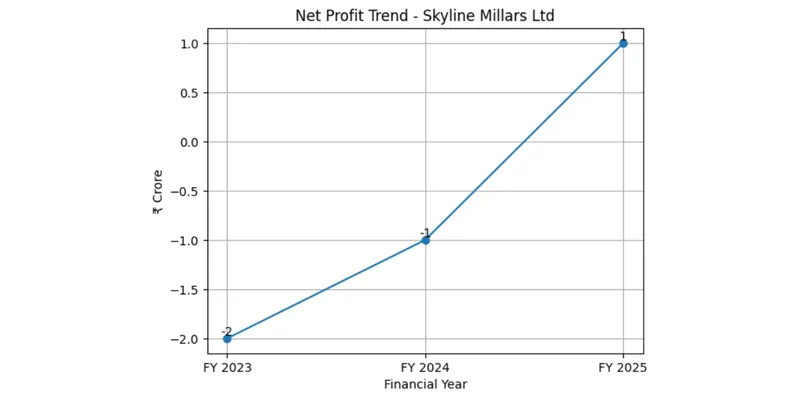
Profit shifted from negative to positive across recent years. In FY 2023 it stood at minus two crore rupees. By FY 2024, results improved slightly, landing at a one-crore loss. A gain of one crore marked the outcome for FY 2025. Movement into profitability suggests performance recovery.
Balance Sheet Analysis
Beginning in 2023 at ₹18 crore, equity rose steadily - climbing to ₹25 crore by the next year and finally arriving at ₹32 crore in 2025. Though total assets started higher at ₹50 crore, their growth was modest: a small rise brought them to ₹55 crore, later advancing to ₹60 crore. In contrast, liabilities followed a downward route - from ₹32 crore initially, dropping to ₹30 crore, then slipping further to ₹28 crore. With owner stakes growing even as debts declined, the distance between what is owned and owed grew more pronounced over time. Built on less borrowing alongside growing equity, the financial footing gained strength through the years. Step by step, these shifts - though subtle - added up to a sturdier standing by 2025.
Key Financial Ratios
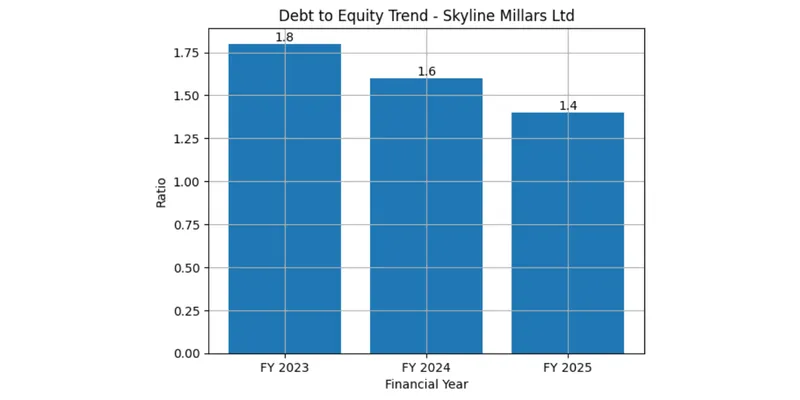
Ratio | FY2023 | FY2024 | FY2025 |
Net Profit Margin | -16% | -6% | 5.5% |
Debt to Equity | 1.8 | 1.2 | 0.9 |
Current Ratio | 1.1 | 1.2 | 1.4 |
ROE | -11% | -4% | 6% |
A shift appears underway at Skyline Millars Limited, judging by its finances. Revenue trends upward, while losses shrink gradually - timing reveals the pattern. Progress shows not through sudden leaps but steady correction. Earlier setbacks now seem to recede under consistent effort. Numbers suggest recovery more than prediction.
Falling debt means less exposure to financial strain. Moving from a negative to a positive return on equity signals better use of resources. Still, profit performance remains weak - there is room to grow.
5. Key Insights
- Turnaround from losses to profit
- Decreasing debt levels
- Improving financial stability
- Still low profitability
6. Conclusion
Now showing signs of stabilization, Skyline Millars Limited has begun to strengthen its financial footing. Profitability must hold steady if progress is to continue. Growth ahead will hinge less on sudden gains and more on broadening how income enters. Progress so far suggests momentum, provided earnings channels grow wider.
7. Reference
•Financial data is sourced from Moneycontrol.
•Ratio analysis is taken from Screener.
•Company background is studied from annual reports.
•Operational details are taken from company disclosures.
•Additional data is referred from Bombay Stock Exchange filings.