Financial Analysis Report Gini Silk Mills Limited
1. Introduction
Started in 1963, Gini Silk Mills Limited operates out of Mumbai as a maker of textiles. The firm trades on the BSE under code 531744, known also by its symbol GINISILK. By July of 1995, it shifted into a public limited structure after beginning life years earlier.
A single name stands behind their fabrics - GINI, known where they make cloth plus handle outside finishing tasks. Production ties closely to services offered, linking each step without extra names getting in the way. Branding stays fixed while work moves through different stages quietly.
From cotton fields to factory floors, India’s cloth-making industry shapes about 2.3 percent of national output while offering jobs to millions - Maharashtra stands out where threads turn into livelihoods.
Nowadays, smaller players in shirting and suiting must deal with pressure coming from big mill operations that handle everything under one roof. A shift has happened as national fabric chains gain ground through structured store networks.
Competition isn’t just louder - it’s reshaped by scale and reach of these new market forces. What once felt manageable now feels crowded thanks to tighter coordination among major suppliers. Behind the scenes, advantage leans toward those who control production straight through to point-of-sale.
2. Company Overview
Founded as a private venture way back in 1963, it stepped into public status by mid-1995. Based out of Maharashtra, its legal roots are planted there.
Fabric sales happen through the GINI label, while another part of earnings comes from handling outside orders for material treatment. Some money arrives by selling garments directly, others flow in when working on textiles for external clients.
Starting strong - GINI labels the shirting plus suiting textiles made here. Fabric blends mix cotton alongside polyester for structured wear. Dress materials come in varied compositions, not just one type. Processing jobs are handled too, beyond finished goods.
By March 2026, its market value reached ₹24.7 crore - falling into the smallest tier of company size. Though it grew revenues at about 2% per year over five years, that pace lags behind most peers who averaged between 6% and 7%. Size-wise, it remains on the very low end compared to others in the sector.
3. Promoter / Founder Introduction
Starting out back then, two brothers stepped into business after years spent handling fabrics across Maharashtra. One began his journey in weaving centers during the 80s, the other built connections through market towns by the 90s. Their path unfolded quietly, shaped by long seasons dealing thread, cloth, supply chains. Experience came not from headlines but early mornings, fabric checks, shipment delays. From those rhythms grew a shared effort rooted in steady work, local knowledge. Each decision later traced back to lessons learned on crowded loading docks, dusty warehouses.
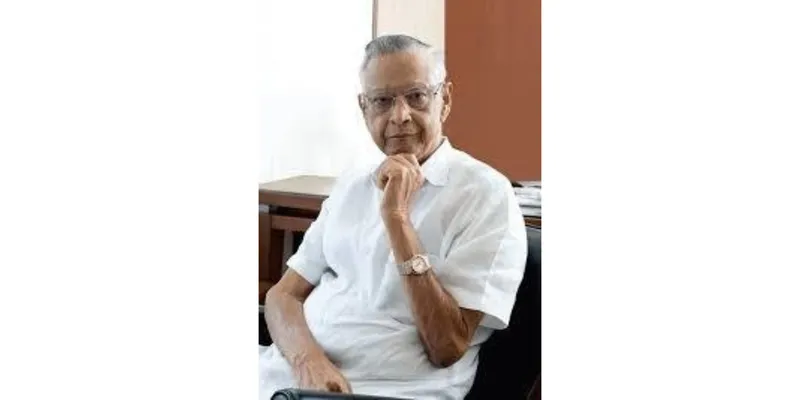
Right now, the person who runs things owns three quarters of the company - this shows they are deeply invested. Their success ties directly to how well others do. When leaders have skin in the game, choices tend to reflect long-term thinking. Ownership at this level often means decisions support everyone involved.
Facing tough times in cloth making, the Harlalka family kept profits alive. Through shifts in demand, they leaned on brand-name fabrics while steady contract work cushioned dips. Profits held firm thanks to that mix.
Stable promoter hold maintains governance yet restricts broader institutional involvement.
4. Financial Statement Analysis
4.1 Income Statement
Particulars | FY2022 | FY2023 | FY2024 | FY2025 |
Net Revenue (Sales) | 39.26 | 43.81 | 43.73 | 40.03 |
Operating Profit (EBITDA) | 1.68 | 2.36 | 2.57 | 1.51 |
Net Profit | 1.20 | 1.53 | 3.04 | 1.80 |
OPM % | 4.28% | 5.39% | 5.88% | 3.77% |
Net Profit Margin % | 3.06% | 3.49% | 6.95% | 4.50% |
Not much movement in revenue across four years. Highest point came in FY23 - 43.81 crore rupees. After that, things dipped. By FY25, it stood at 40.03 crore. That is down by 8.46 percent overall.
Profit hit a high of Rs. 3.04 Cr in FY24, driven by unusually strong other income - Rs. 2.83 Cr - not by regular business earnings. The main operations still show minimal gain.
4.2 Balance Sheet Analysis
Particulars (Rs. Cr) | FY2023 | FY2024 | FY2025 |
Total Assets | 62.14 | 65.43 | 62.77 |
Total Debt | 10.52 | 8.13 | 3.76 |
Total Equity (Net Worth) | 48.33 | 50.76 | 50.98 |
Book Value Per Share (Rs.) | 86.66 | 91.07 | 91.46 |
Down from Rs. 10.52 Cr in FY23, total debt now sits at Rs. 3.76 Cr by FY25 - bringing the firm nearly free of borrowed money. Though once heavy, obligations have lightened fast, shifting how the business operates.
With less owed, cash flow eases up, allowing room to breathe where there was tightness before. Year after year, payments chipped away at balances until only a fraction remained. Now, nearing zero reliance on loans, operations stand stronger without lenders looming.
Even though profits have been small, net worth hasn’t changed much - still around Rs. 51 Cr - because the company holds strong on its own funds.
4.3 Cash Flow Analysis
Cash Flow (Rs. Cr) | FY2022 | FY2023 | FY2024 | FY2025 |
Operating Activities | -3.77 | 0.37 | 3.55 | 1.82 |
Investing Activities | -0.03 | 0.81 | -2.77 | 3.16 |
Financing Activities | 3.45 | -1.17 | -0.75 | -4.92 |
Net Cash Change | -0.36 | 0.00 | 0.03 | 0.06 |
At Rs. 91.46 per share, the book value for FY25 stands well above the current market rate of Rs. 44 - showing it trades below its base worth.
Though priced lower now, the gap hints at underlying strength when measured by assets minus liabilities. Value seekers might notice this difference between what's recorded and what's traded.
Now sitting in positive territory, operating cash flow held steady at Rs. 1.82 Cr during FY25 thanks to tighter control over working capital.
Rs 3.16 crore investment outflow in FY25 tied to asset sales for debt reduction.
4.4 Key Financial Ratios
Ratio | FY2023 | FY2024 | FY2025 |
Return on Equity (ROE) | 3.17% | 5.99% | 2.24% |
Return on Capital Employed (ROCE) | 4.12% | 6.80% | 3.23% |
Debt-to-Equity Ratio | 0.22x | 0.16x | 0.07x |
Net Profit Margin | 3.49% | 6.95% | 4.50% |
Stock P/E (FY25) | — | — | 14.6x |
5. Key Insights & Interpretation
5.1 Strengths
A big drop in what was owed - Rs. 10.52 Cr down to Rs. 3.76 Cr within twenty-four months - shows much less pressure now. Fewer loans mean fewer worries piling up. Money matters feel lighter after that kind of shift. Risk fades when numbers like that move quickly. Less hanging over the head makes planning easier.
A name that stuck around - GINI means something to folks trading cloth across Maharashtra, thanks to sixty years of showing up.
One thing stands out - promoters hold three-quarters of shares, showing they stick around. Their skin in the game speaks volumes about direction. Stability isn’t guessed here, it’s built into choices made daily. Ownership like this doesn’t chase short wins. Long-term thinking shapes every move behind the scenes.
5.2 Weaknesses
Revenue has barely moved forward. Over five years, growth averages about 2%, stuck near the same level year after year. The business hovers between 40 and 44 crore rupees annually. Moving past that range hasn’t happened so far.
Still running on slim profits. Operating margin below four percent by next year means any spike in material costs could hurt. A weak dollar might pinch too. Little room to absorb surprises shows up clearly in the numbers. Pressure builds when expenses climb unexpectedly. Profits barely cover shifts beyond control. Margin pressure sticks around through fiscal twenty-five.
5.3 Risk Factors
When cotton swings, profits often shrink. Yarn made from oil follows its own wild path. Pressure builds even if sales stay steady.
Not seeing the usual numbers at stores this year - sales dropped 8.46% in FY25, hinting that less product is moving through retail networks. Despite steady supply, shops aren’t pulling in what they once did. A slower pace now could mean adjustments later on down the line.
5.4 Future Outlook
With less debt, the company can put money back into products and how they reach customers - no pressure on finances slowing things down. A lighter loan load opens space to grow what matters, quietly funding upgrades instead of interest. Money once tied up now moves freely, shaping improvements where it counts.
Freed from heavy payments, resources shift naturally toward innovation and access. Breathing room appears when debts shrink, letting effort go toward building rather than balancing.
Might be a comeback for name-brand cloth shops in smaller towns, giving old names such as GINI a boost in sales numbers. What seemed outdated is gaining ground where price matters less than trust.
6. Conclusion
Gini Silk Mills Limited makes fabrics. For sixty years it stayed profitable. Its balance sheet now gets stronger fast. A familiar name in its corner of the market. Profits keep coming year after year. Debt dropped notably by fiscal 2025. Growth in sales though? Hardly moving. Shareholders see no dividends ever paid out. That holds back wider interest from investors. Strong finances help, yet missing revenue growth hurts.
Seen through an investor lens, shares sit well below their book worth - just 48% of it - a setup that might appeal to those willing to wait years, even if trading moves slowly. A pickup in sales momentum could shift things. So could a first-ever payout to shareholders. That kind of change may push prices higher over time. Patience becomes part of the equation here. Value stays hidden until something sparks notice.
Data Sources
Screener.in Financial Data 531744
TickerTape.in Quarterly Results Gini Silk Mills
Motilal Oswal Cash Flow Statements
BSE India Ginitex com Annual Reports and Filings