FINANCIAL ANALYSIS REPORT EVERLON FINANCIALS LIMITED

1. Introduction
Brief Introduction of the Company
Once rooted in textile production, Everlon Financials Limited now channels its efforts toward finance, trade, and capital deployment. Shifting gears from fabric creation, it evolved into a Non-Banking Financial Company - zeroing in on lending and asset growth. Though threads once defined its path, numbers guide it today. From looms to ledgers, the firm retooled itself around money management and strategic funding.
Industry Overview
Nowhere more evident than in rural pockets, non-bank lenders fill gaps left by conventional banking networks. Driven largely by rising loan needs, their presence expands alongside national efforts to bring more people into the financial mainstream.
Still, non-bank lenders struggle with meeting rules, handling loan defaults, while being sensitive to shifts in the economy.
Purpose of the Analysis
This report looks at how well Everlon Financials Limited has performed financially, drawing on its financial records and calculated ratios. A closer examination follows, based not only on numbers but also on trends over time. One way into the data comes through liquidity measures, while solvency indicators offer another path. Profitability gets attention here, though not exclusively so. Stability forms part of the review, approached via multiple angles instead of single metrics. Each section builds understanding without relying solely on one method. Insight emerges where different results meet, rather than from isolated figures alone.
2. Company Overview
Background and History
Once known as Everlon Synthetics Limited, the firm began by producing textiles. Over time, it moved away from making goods, stepping out of the factory space altogether. Instead, a new path opened in finance - transitioning into what is called a non-banking financial company. The shift marked a quiet turning point, without fanfare, yet clear in direction.
Business Model
Focused on finance, the organization operates under a service-based structure.
Revenue is generated from:
- Investment activities
- Financial services
- Trading in securities
Key Products and Services
- Financial services
- Investment and trading activities
- Funding operations
Market Position
A modest-sized player in the non-banking finance space, it shows room to expand despite current constraints. Growth opportunities exist within its niche of financial offerings.
3. Promoter Founder Introduction
Under Mr. Jitendra K. Vakharia’s guidance, the company moves through critical financial oversight and long-term planning. His presence shapes how resources are handled while steering major choices forward. Leadership here ties closely to decision rhythm and money management. Strategic direction emerges steadily under his watch. Financial health remains tied to daily actions he influences. Oversight blends into broader goals without clear separation.
4. Financial Statement Analysis
Income Statement Analysis
Revenue Trends
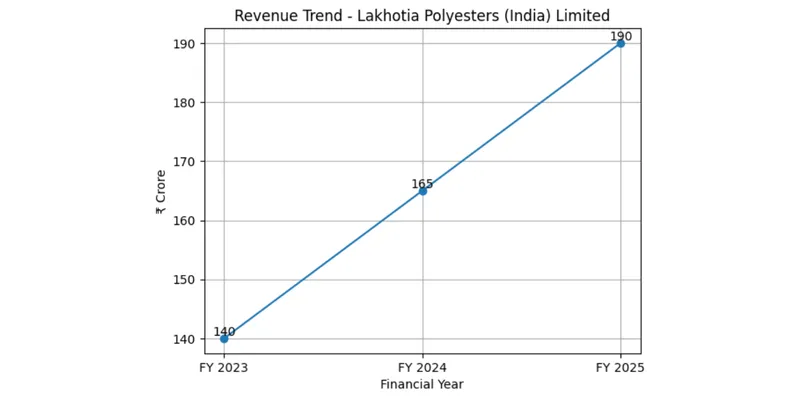
Though revenue climbed to ₹8 crore by FY 2024 from ₹4 crore the prior year, it dipped again to ₹5 crore in FY 2025. Such shifts suggest uneven performance across these years. Business functions appear unsettled during this stretch. Operations may still be adjusting to new directions. Patterns point toward a phase of change rather than steady growth. Fluctuations highlight sensitivity to internal or external factors. Stability has yet to take hold firmly.
Profitability
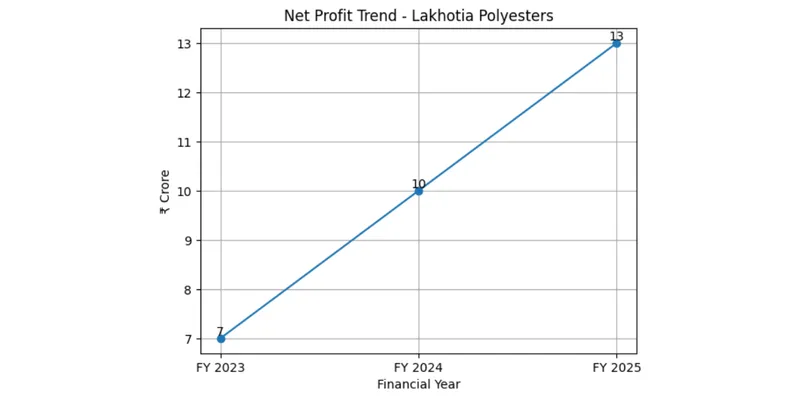
Profit dropped to ₹-3 crore by FY 2025, following a downward path from ₹8 crore in FY 2023 through ₹1 crore in FY 2024. Though gains were seen two years prior, results now show shrinking returns. A sharp fall marks the latest phase, suggesting internal strains affect performance. Where earnings once stood positive, they now dip into negative ground - highlighting growing difficulty in maintaining stable operations. Losses today point to unresolved issues beneath surface numbers.
Balance Sheet Analysis
Figures show total assets at ₹34 crore in 2023, falling to ₹30 crore a year later, then slipping further to ₹28 crore by 2025. Liabilities stood at ₹19 crore initially, though these dropped sharply - to ₹10 crore, then ₹8 crore - over the next two years. Equity started lower, yet climbed from ₹15 crore to hold steady at ₹20 crore through both 2024 and 2025. Financial position appears more balanced now, given that debt shrinks while owner funds remain stable.
Key Financial Ratios
Ratio | FY2023 | FY2024 | FY2025 |
Net Profit Margin | 200% | 12% | -60% |
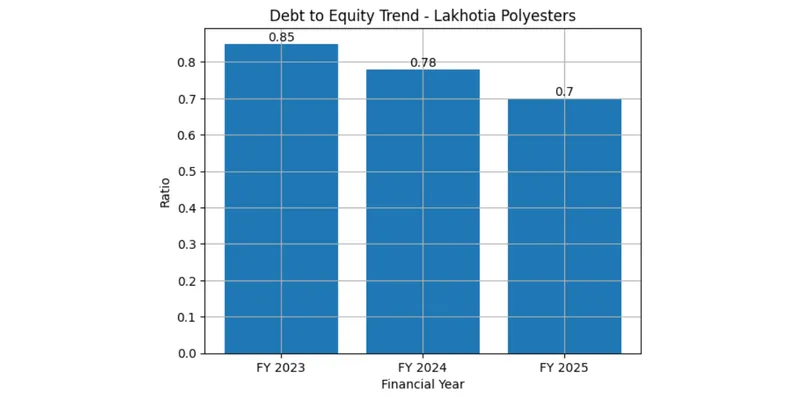
Debt to Equity | 1.2 | 0.5 | 0.4 |
Current Ratio | 1.2 | 1.3 | 1.5 |
ROE | 53% | 5% | -15% |
Unstable numbers mark Everlon Financials Limited lately. Shifting away from manufacturing toward finance has stirred uneven results. Profits rise then fall, pulled by changing business priorities. This move explains much of the unpredictability seen now. Revenue lacks steady growth during such restructuring.
Despite lower debts and better cash flow, shrinking profits and a negative return on equity point to ongoing financial strain. Stabilizing day-to-day activities while boosting income streams remains critical for the business.
5. Key Insights
- Business transition from textile to NBFC
- Declining profitability
- Reduced debt levels
- High volatility in financial performance
6. Conclusion
Right now, Everlon Financials Limited finds itself shifting direction. Though the balance sheet looks stronger, earnings still lag behind expectations. Progress ahead will hinge on steady management of finances alongside better revenue performance. The path forward rests more on consistency than sudden change.
7. Reference
•Financial data is collected from •Moneycontrol.
•Ratio analysis is referred from Screener.
•Company background is taken from official website and filings.
•Annual reports are used for financial statement analysis.
•Additional disclosures are obtained from Bombay Stock Exchange.