Financial Analysis Report Akshar Spintex Limited

1. Introduction
Akshar Spintex LimiteSecond only to one country in making cotton yarn, India finds its heart in Gujarat where thread gets spun. A major player worldwide, the state powers much of what keeps lood makes textiles in Gujarat, shows up on the BSE under 541303 while also trading on the NSE as AKSHAR. Though rooted locally, its market presence stretches across exchanges. One sees operations tied to fabric production, yet investor interest plays out through stock codes. Location anchors it, but listings widen reach. Not just regional anymore, since numbers link it beyond state lines.
Focused on making and selling cotton yarn, it reaches buyers at home plus abroad. Though small in size, its reach stretches across borders too.
ms busy across regions.
Around 2.3 percent of India's economy comes from textiles - this industry also gives jobs to many people.
One way to judge how well a business runs is by looking at its daily operations. Profit patterns over time reveal more than just numbers on paper. What draws investors often hides between costs and returns.
2. Company Overview
Founded on 19 June 2013 in Jamnagar Gujarat.
Public listing came in 2022, after shifting to a public limited structure five years earlier. Trading began on both NSE and BSE that May, following the corporate change made back in 2017.
Working through business-to-business production, it delivers thread to cloth makers, clothing shippers, also dealers.
Few things matter more than moving large amounts of cotton yarn to textile makers down the chain. Volume shifts directly shape how much comes in. Sales figures rise when shipments grow steady. What flows out determines what returns. The business lives on consistent delivery, nothing flashy - just thread after thread reaching factories that weave further.
Fine cotton yarn, between 16s and 44s counts, comes out of a setup running 24,480 spindles nonstop.
By March 2026, its market cap sat near Rs. 30 Crore - firmly within the micro-cap range. That figure reflects a small player in today’s landscape. Size-wise, it trails far behind larger counterparts. Yet, such numbers often signal early-stage potential. Valuation remains modest when compared to industry leaders. Still, low capitalisation does carry inherent volatility
3. Promoter Or Founder Intro
Chairing the group is Mr. Harikrishna Chauhan.
Harry Paghadar Executive Director appointed 2026.
Bhavin Kothiya holds a non-executive independent director role, confirmed until 2026. His position stands apart from daily operations, focused on oversight. Renewed for another term, his involvement continues without shift in function. Independence remains a key part of his contribution through the coming years.
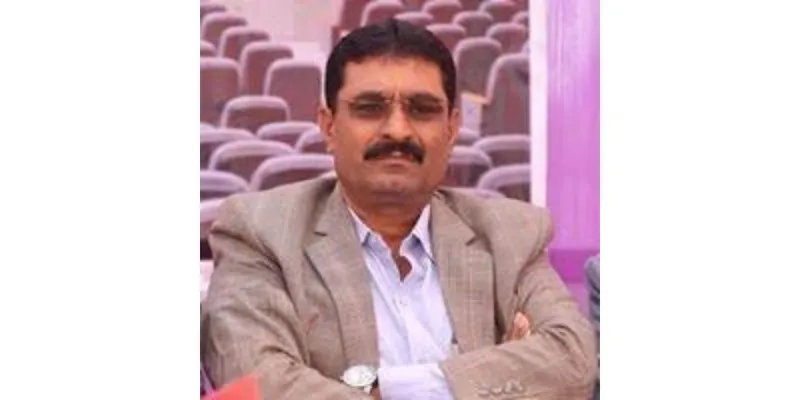
A fresh start in business, rooted in Gujarat’s fabric scene, where years were spent handling raw cotton and turning it into yarn. Early steps shaped by hands-on work buying materials, then mastering the spin mills. Not theory - real time learning on how cloth begins. Decades deep in threads, bales, and loom-side decisions. Starting small, thinking long, building from what was known: fiber, supply chains, making things last.
Starting small, the leadership guided expansion into public markets. Growth followed steady steps under their direction. From private roots emerged a traded business. Their oversight shaped each phase quietly. Public status arrived through consistent effort.
4. Financial Statement Analysis
4.1 Income Statement Analysis
Annual figures in Rs. Crore | Source: Screener.in, TickerTape, Motilal Oswal
Particulars | FY2022 | FY2023 | FY2024 | FY2025 |
Revenue (Net Sales) | 115.55 | 153.58 | 174.96 | 116.77 |
Operating Profit (EBITDA) | 3.29 | 7.36 | 7.74 | -2.44 |
Net Profit / (Loss) | 1.34 | 4.27 | 3.46 | -4.45 |
EPS (Rs.) | 0.02 | 0.05 | 0.04 | -0.06 |
OPM % | 2.85% | 4.79% | 4.42% | -2.08% |
Net Profit Margin % | 1.16% | 2.78% | 1.98% | -3.81% |
FY25 saw revenue drop sharply by 33.26%, landing at Rs. 116.77 Cr after hitting a high of Rs. 174.96 Cr in FY24; that rise came on the back of Rs. 115.55 Cr recorded two years earlier in FY22.
A peak came in FY23 - net profit hit Rs. 4.27 Cr. After that, things dipped to Rs. 3.46 Cr in FY24. Then suddenly, by FY25, numbers swung below zero into a net loss: Rs. 4.45 Cr.
4.2 Balance Sheet Analysis
Particulars (Rs. Cr) | FY2023 | FY2024 | FY2025 |
Total Assets | 67.82 | 74.54 | 92.23 |
Net Fixed Assets | 24.01 | 22.87 | 36.99 |
Total Debt | 14.97 | 10.19 | 10.41 |
Total Equity (Net Worth) | 49.73 | 53.21 | 48.43 |
Book Value Per Share (Rs.) | 0.63 | 0.68 | 1.08 |
Fresh money poured into machines and daily operations pushed the overall worth up - now sitting at Rs. 92.23 Cr by March 2025. That jump? Built on stronger foundations and more cash moving through the business.
Fewer obligations now - down from 14.97 crore rupees in FY23 to 10.41 by FY25, showing payments were made. Money owed dropped over two years, thanks to consistent reductions.
Falling profits ate into shareholder funds, pulling the net worth down to Rs. 48.43 Cr by year-end 2025. Equity took a hit because losses piled up through the fiscal period.
4.3 Cash Flow Statement Analysis
Cash Flow (Rs. Cr) | FY2022 | FY2023 | FY2024 | FY2025 |
Operating Activities | 1.91 | 9.84 | 4.77 | -29.57 |
Investing Activities | -0.19 | -0.18 | -4.50 | -2.26 |
Financing Activities | -1.76 | -9.69 | -0.27 | 34.62 |
Net Cash Flow | -0.04 | -0.03 | -0.01 | 2.79 |
A steep drop in operating cash flow hit Rs. 29.57 crore negative during FY25, pointing to growing strain in handling day-to-day finances. Though profits may show gains on paper, actual money moving out exceeded inflows by a wide margin that year
A chunk of money - 34.62 crore rupees - flowed in during FY25. That kind of entry often points to new loans being taken on. It could also mean shares were sold to bring cash into the business. Operations tend to need support when funds arrive like this. Fresh capital usually means activity is picking up.
4.4 Key Financial Ratios
Ratio | FY2023 | FY2024 | FY2025 |
Return on Equity (ROE) | 8.59% | 6.50% | -9.19% |
Return on Capital Employed (ROCE) | 10.21% | 9.44% | -6.01% |
Debt-to-Equity Ratio | 0.30x | 0.19x | 0.21x |
Current Ratio (approx.) | 1.8x | 2.1x | 1.3x |
Net Profit Margin | 2.78% | 1.98% | -3.81% |
Working Capital Days | 67 | 80 | 154 |
5. Key Insights And Interpretation
5.1 Strengths
Built on little borrowed money: the debt-to-equity ratio hits just 0.21x by FY25. That means equity weighs far more than what's owed. Near-zero reliance on loans defines its financial stance.
Folks who need different kinds of thread will find carded, combed, organic, or BCI-approved options here. While some prefer softer textures, others look for eco-conscious picks - each type fits a unique demand. From basic weaves to stricter sustainability needs, the selection covers ground without stretching too thin.
5.2 Weaknesses
Four point four five crore rupees lost last year shows operations need serious fixing. That much red ink means something fundamental keeps breaking down inside. A deficit like this rarely happens by accident, usually points to deeper cracks. Money going out faster than coming in cannot continue forever. This kind of result does not appear suddenly, it builds slowly over time.
5.3 Risk Factors
Sure thing jumps out fast - cotton costs swing hard, tugging production expenses along with them. Profit space shrinks when those swings go upward. Wild pricing shows up without warning, shaping how much each batch eats into earnings. What stays clear is the link between field markets and factory output.
Fashion trends overseas shape how much fabric mills will sell. What happens in international markets decides factory orders months later. Shifts in buyer choices ripple back through supply chains slowly. Retail seasons in big countries set the pace for production needs here.
5.4 Future Outlook
Stability in cotton pricing sets the stage - only then does a rebound take shape. Demand waking up at home plays its part, while overseas appetite returns slowly behind it.
Beyond the numbers, a bigger spend on machines and buildings stands clear - Rs. 36.99 Cr this year compared to last year’s Rs. 22.87 Cr. Should buyers return, output could rise without delay. That kind of setup often follows when firms bet on rebounding markets.
6. Conclusion
Akshar Spintex Limited makes cotton yarn, small in size but known for its range of products and a factory placed smartly for logistics. Growth showed up clearly from 2022 through 2024, hitting a high point at Rs. 174.96 Crore in income. Then came 2025 - things shifted hard the opposite way. Sales dropped more than one-third that year. Profit margins slipped below zero during operations. Losses landed at Rs. 4.45 Crore when all was tallied.
Even so, profits keep shrinking. Still, debt levels stay low. Yet operating cash flow keeps getting worse. What stands out is how long it now takes to turn inventory and receivables into cash. On top of that, promoters barely hold any shares anymore. Without clear signs of stronger sales, better margins, or healthier cash flow, the stock looks shaky. Stability on paper hides deeper flaws underneath.
Data Sources
- Screener.in — Profit & Loss, Balance Sheet, Key Ratios: https://www.screener.in/company/AKSHAR/
- TickerTape.in — Quarterly and Annual Results: https://www.tickertape.in/stocks/akshar-spintex-AKS
- Motilal Oswal — Cash Flow Statements: https://www.motilaloswal.com/share-market/akshar-spintex-ltd
- NSE India / BSE India — Stock Exchange Filings