EUREKA INDUSTRIES LIMITED
1. Introduction
Eureka Industries Limited (EUREKAI) is a BSE-listed micro-cap started November 3, 1992 in Ahmedabad, Gujarat. Eureka Spinners Limited, started cotton yarn spinning at Valthara, Dholka plant in November 1994. Renamed Eureka Industries Limited in 1993.
History splits in two. For almost 30 years (FY95–FY23), it was a sleepy yarn maker with Rs. 0–8 crore revenue yearly. Then September 30, 2023 AGM resolution switched main object to agro trading wheat, rice, paddy, maize, pulses. Revenue exploded to Rs. 19 crore FY24, Rs. 85 crore FY25.
But red flags: original promoters ditched to 0% holding by FY23 (100% public), Rs. 12 crore losses FY24 made book value deep negative.
Report looks at background, promoters, FY22–FY24 finances.
2. Company Overview
Background and History
Eureka Industries Limited was incorporated in November 1992 and commenced cotton yarn spinning at its Dholka, Ahmedabad plant from 1994. It was promoted by Mrs. Anna R. Malhotra and Mr. Rajesh R. Mehta. For most of its listed life, revenue was negligible and the company was essentially inactive.
Business Pivot — FY24 Onwards
At the AGM held September 30, 2023, shareholders approved a change in the Main Object Clause of the Memorandum of Association. The company abandoned its cotton yarn manufacturing operations (fixed assets are zero on the balance sheet, fully depreciated) and entered agro commodity trading — wheat, rice, paddy, maize, and pulses. This pivot was immediate and dramatic: revenue jumped from Rs. 8 crore (FY23) to Rs. 19 crore (FY24), and then to Rs. 85 crore (FY25). Q3 FY26 revenue was Rs. 34.13 crore in a single quarter, suggesting the agro trading business is actively scaling.
Promoter Exit: The Governance Red Flag
Promoter holding fell from 17.38% in FY22 to 0% by FY23 and has remained at 0% through FY25 and FY26. This means the original promoter family (Malhotra/Mehta group) has fully exited the company. As of the latest available data, 100% of shares are held by the public. The complete absence of any promoter stake is highly unusual and a significant governance concern.
3. Promoter and Management Introduction
Original promoters Mrs. Anna R. Malhotra and Mr. Rajesh R. Mehta completely exited. Screener.in shows 0% promoter holding since FY23. Current board from BSE annual report and announcements:
Name | Designation | Note |
Mamta Prahlad Nishad | Managing Director & CFO | Runs agro trading business |
Priyal Dhrumil Patel | Company Secretary | Handles compliance |
Vinay Nishad | Independent Director | Resigned 12 Feb 2026 (BSE) |
Altaf Hussain | Non-Executive Director | Resigned 12 Feb 2026 (BSE) |
Table 1: Board of Directors (Source: BSE Annual Report FY25 / Announcements)
4. Financial Analysis
Income Statement (FY22–FY24)
Revenue stayed at zero in FY22 with no sales at all. It picked up to Rs. 8 crore in FY23 from early commodity trading, then climbed to Rs. 19 crore in FY24 after the pivot. Expenses outran revenue that year though, Rs. 24 crore spent against Rs. 19 crore earned, leading to an operating loss. Net loss Rs. 5 crore in FY24 from almost nothing prior. OPM dropped from -42% to -5% to -23%, showing agro trading still isn't profitable. No dividends paid ever.
Particulars (Rs. Crore) | FY22 | FY23 | FY24 |
Revenue (Sales) | 0 | 8 | 19 |
Total Expenses | 0 | 9 | 24 |
Operating Profit/(Loss) | 0 | 0 | -4 |
OPM % | -42% | -5% | -23% |
Interest | 0 | 0 | 0 |
Depreciation | 0 | 0 | 0 |
Net Profit/(Loss) | 0 | 0 | -5 |
EPS (Rs.) | 0.00 | -0.07 | -0.79 |
Table 2: Income Statement Summary — FY22 to FY24
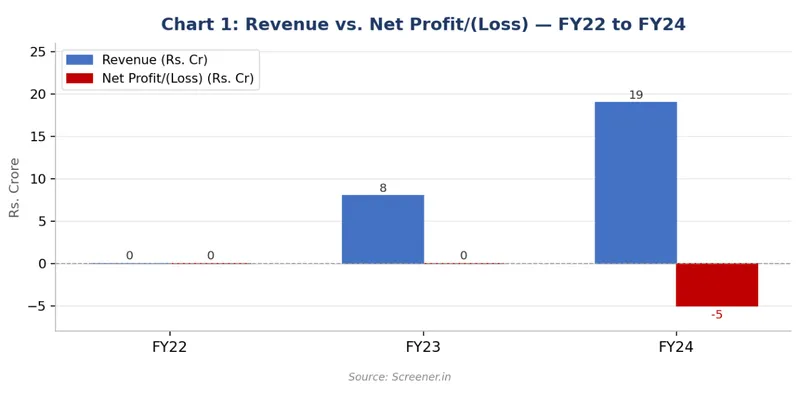
Chart 1: Revenue vs. Net Profit/(Loss) — FY22 to FY24 (Source: Screener.in)
4.2 Balance Sheet (FY22 – FY24)
Total assets dropped from Rs. 9 crore in FY22 to just Rs. 2 crore in FY24 after paying off borrowings. Equity capital stayed at Rs. 9 crore, but reserves went more negative each year Rs. -7 crore (FY22), -8 crore (FY23), and -12 crore (FY24)—from piled-up losses, so net worth turned negative by FY24 and left the company technically insolvent on paper. Borrowings reduced from Rs. 8 crore to Rs. 1 crore over that time. Fixed assets hit zero since all machinery was fully depreciated. Even so, this tiny balance sheet now backs Rs. 85 crore worth of agro trading in FY25, mostly through Rs. 8 crore in trade payables.
Particulars (Rs. Crore) | FY22 | FY23 | FY24 |
Equity Capital | 9 | 9 | 9 |
Reserves (accum. loss) | -7 | -8 | -12 |
Borrowings | 8 | 4 | 1 |
Other Liabilities | 0 | 3 | 4 |
Total Assets | 9 | 7 | 2 |
Fixed Assets | 0 | 0 | 0 |
Book Value/Share (Rs.) | ~Rs.2 | ~Rs.1 | ~Rs.-0.2 |
Table 3: Balance Sheet Summary — FY22 to FY24 (Source: Screener.in)
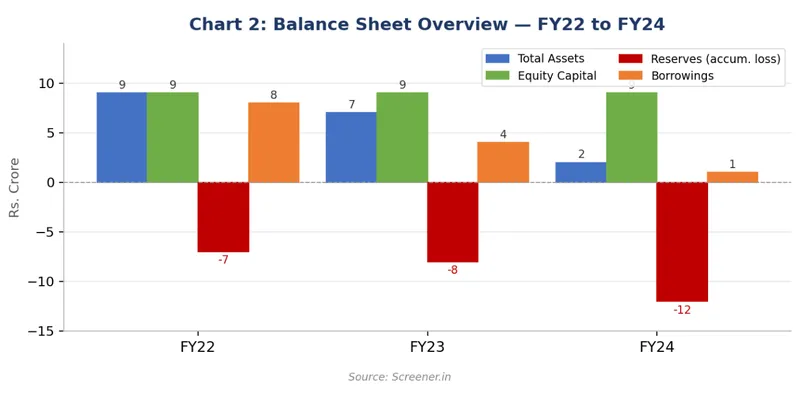
Chart 2: Balance Sheet Overview — FY22 to FY24 (Source: Screener.in)
4.3 Cash Flow (FY22 – FY24)
Operating cash flow stayed near zero FY22, went positive Rs. 1 crore FY23 as trading collections kicked in, then dived to -Rs. 4 crore FY24 from working capital needs in agro trading. Investing had Rs. 6 crore inflow FY24. Financing showed Rs. 8 crore inflow FY22 (new debt for trading startup) and -Rs. 3 crore FY24 (some repayment). Net cash barely moved.
Cash Flow (Rs. Crore) | FY22 | FY23 | FY24 |
|---|---|---|---|
Operating | 0 | 1 | -4 |
Investing | -8 | 3 | 6 |
Financing | 8 | -4 | -3 |
Net Change | 0 | 0 | 0 |
Table 4: Cash Flow Summary — FY22 to FY24 (Source: Screener.in)
4.4 Key Ratios
Ratio | FY22 | FY23 | FY24 | Observation |
ROCE % | 0% | -6% | -381% | Collapsed in FY24 |
OPM % | -42% | -5% | -23% | Losses on new biz |
Debtor Days | 0 | 37 | 0 | Low — cash trading |
Cash Conv. Cycle | 0 | 37 | 0 | Improving |
EPS (Rs.) | 0.00 | -0.07 | -0.79 | Loss worsened in FY24 |
Promoter Holding | 17.38% | 0% | 0% | Full exit |
Book Value/Share | ~Rs.2 | ~Rs.1 | ~Rs.-0.2 | Turned negative FY24 |
Table 5: Key Financial Ratios — FY22 to FY24 (Source: Screener.in)
Key Ratios Analysis (FY22 – FY24)
ROCE at -381% FY24, but capital base was almost nothing, so normal losses blew up the ratio, showing too little capital for a big trading scale. OPM went from -42% FY22 (dormant phase), improved to -5% FY23, then -23% FY24 scaling up before profits hit. Debtor days 0-37 is good, no long credit risk. Cash cycle matching that confirms quick turnover, perfect for commodities. EPS losses deepened to -Rs. 0.79 FY24 building the new business. Promoter holding crashing leaves a huge governance gap. Book value per share flipped from Rs. 2 to -Rs. 0.2 FY24, losses are all equity, balance sheet insolvent though FY25 profits started recovery.
5. Key Insights and Interpretation
The company's pivot from dormant cotton yarn spinning to agro commodity trading drove revenue from zero to Rs. 85 crore in FY25, with low debtor days (0–37) indicating cash-based operations typical of commodities.
ROCE Breakdown
FY24's -381% ROCE stems from near-zero net worth amplifying modest losses into extreme negatives—a mathematical effect confirming inadequate capital for the trading scale, not operational catastrophe.
Promoter Risk
Promoters' full exit (17.38% in FY22 to 0% in FY23), plus two director resignations in February 2026, leaves governance vulnerable despite Ms. Mamta Prahlad Nishad's rapid agro trading growth.
Future Potential
FY25's Rs. 85 crore revenue and Rs. 2 crore profit signal traction, potentially erasing losses and positive book value if sustained. Yet, no promoters, thin commodity margins, and Rs. 8 crore balance sheet funding massive payables heighten operational/financial risks, stock remains highly speculative.
6. Conclusion
Eureka Industries Limited transitioned from a near-dormant cotton yarn manufacturer to a growing agro commodity trader, achieving Rs. 85 crore revenue in FY25.
The pivot, starting in FY24, faced initial losses Rs. 5 crore net loss despite revenue growth, Rs. 12 crore accumulated losses creating negative book value, and zero promoter holding since FY23.
FY25 BSE filings indicate partial recovery, but absent promoter ownership, two director resignations in February 2026, and commodity trading's thin margins render it a speculative, high-risk turnaround still in progress.
Sources:
- Screener.in
- BSE