ENTERPRISE INTERNATIONAL LIMITED

1. Introduction
Company Overview
Enterprise International Limited trades mainly in textile goods. It's a small-cap company based in Kolkata, West Bengal, started in 1989. Handles silk fabrics, raw silk, tussah silk, thrown silk yarn, linen yarn, polyester fabrics. Also deals in auto parts and food like fruit and nuts. Used to be Karni Industries before going full trading.
Industry Overview
Textile trading in India is big but cutthroat. The country leads in textile production and buying, with importers and traders supplying fabric and yarn to makers and stores. Silk and specialty fabrics hit premium markets. Auto parts trading grows with India's car industry.
Traders see thin margins just buy and resell, no manufacturing markup. Revenue swings with trade volumes, import costs, customer orders. Needs strong buyer ties and tight inventory to survive heavy competition.
Purpose of the Report
Studies Enterprise International's business background, promoters, recent financials, and overall health.
2. Company Overview
2.1 Background and History
Enterprise International Limited began on November 10, 1989.
Started making and selling silk textiles plus synthetic dyes. Later dropped manufacturing for full trading. Kotak Securities and BSE filings show years of importing and selling textile goods domestically. Added auto parts trading in 2018. The website lists it as a trader of manmade/natural fabrics and yarn for India only.
2.2 Business Model
Imports silk fabrics, raw silk, tussah silk, thrown silk yarn, linen yarn, polyester fabrics, auto parts sold in India. No manufacturing. Asset-light keeps fixed costs low, but everything rides on trade volumes and per-deal margins.
Trading margins stay negative. Goods costs and expenses top sales. Profits come from other income like investment interest and non-trading stuff.
2.3 Key Products and Services
Main products include silk fabrics (raw, tussah, thrown yarn), linen yarn, polyester fabrics, auto parts, fruit/nuts. All domestic sales. Textiles probably still lead since auto parts kicked off in 2018.
2.4 Market Position
Micro-cap at Rs. 6.57 crore market cap in early March 2026 tiny for listed traders. Revenue plunged from Rs. 69.85 Cr FY14 to Rs. 5.25 Cr FY24 and Rs. 6.50 Cr FY25. 22% compounded sales drop over 5 and 10 years. Promoters hold just 33.51%. Shareholders dropped from 5,766 (Mar 2023) to 5,421 (Dec 2025).
3. Promoter / Founder Introduction
Not much detailed background on Enterprise International's promoters shows up in public sources.
Name | Designation | Notes |
|---|---|---|
Debashish Dutta | Director | Current Board Member |
Sudip Kundu | Director | Current Board Member |
Sathy Sadeesh Kumar | Independent Director | Appointed FY25 |
Brijlata Sarda | Director | Mentioned in Filings |
Neetu Khandelwal | Company Secretary | Administrative Role |
Table 1: Board of Directors (Source: BSE Annual Report Filings)
Promoter group holds 33.51% of shares. No dilution happened, but no added stake was a neutral signal to some investors.
No promoter pledging reported. A good sign is no personal financial stress. The company shifted from Karni Industries manufacturing to trading under current management.
4. Financial Statement Analysis
4.1 Income Statement Analysis
The last five years show revenue shrinking overall but steady lately. Hit Rs. 7.17 Cr in FY21, peaked Rs. 8.60 Cr FY22, then dropped to Rs. 6.55 Cr FY23, Rs. 5.25 Cr FY24, and bounced to Rs. 6.50 Cr FY25. 3-year sales growth -9%.
Operating profit lost money four out of five years only FY21 made Rs. 0.24 Cr. Trading itself bleeds cash. Expenses top sales every time.
'Other Income' saves the day, Rs. 0.63 Cr (FY23) to Rs. 1.13 Cr (FY22). Probably interest on investments and deposits.
Net profit stayed positive over the years. FY25 topped thanks to Rs. 1.05 Cr other income. EPS jumped from Rs. 0.13 FY23 to Rs. 1.68 FY25. No dividends ever paid.
Particulars (Rs. Crore) | FY21 | FY22 | FY23 | FY24 | FY25 |
Revenue from Operations | 7.17 | 8.60 | 6.55 | 5.25 | 6.50 |
Total Expenses | 6.93 | 9.43 | 6.99 | 5.61 | 6.93 |
Operating Profit/(Loss) | 0.24 | -0.83 | -0.44 | -0.36 | -0.43 |
Other Income | 0.80 | 1.13 | 0.63 | 0.71 | 1.05 |
Net Profit/(Loss) | 0.69 | 0.14 | 0.04 | 0.15 | 0.50 |
EPS (Rs.) | 2.31 | 0.47 | 0.13 | 0.50 | 1.68 |
Table 2: Income Statement Summary — FY21 to FY25 (Source: Screener.in)
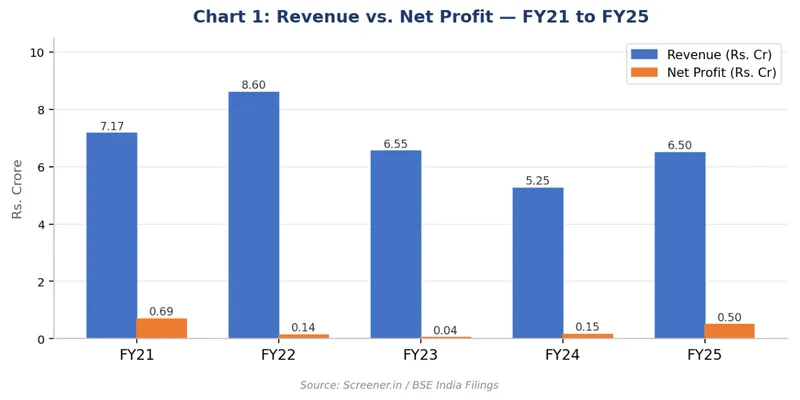
Chart 1: Revenue vs. Net Profit — FY21 to FY25 (Source: Screener.in / BSE India)
4.2 Balance Sheet Analysis
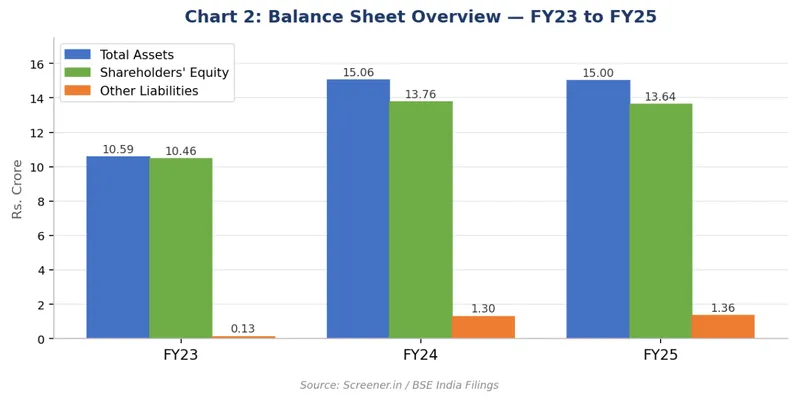
Total assets Rs. 10.59 Cr FY23, jumped to Rs. 15.06 Cr FY24, held at Rs. 15.00 Cr FY25. FY24 surge came from investments blowing up from Rs. 0.19 Cr to Rs. 6.64 Cr on surplus cash. FY25 dipped to Rs. 4.35 Cr, maybe some cash-outs.
No borrowings since FY23. Earlier borrowings are all cleared now. Equity climbed from Rs. 10.46 Cr FY23 to Rs. 13.64 Cr FY25 on kept profits. Book value per share Rs. 45.67 FY25 way above market price.
Other liabilities ticked up from Rs. 0.13 Cr FY23 to Rs. 1.36 Cr FY25 probably trade payables or accruals.
Particulars (Rs. Crore) | FY23 | FY24 | FY25 |
Equity Capital | 2.99 | 2.99 | 2.99 |
Reserves | 7.47 | 10.77 | 10.65 |
Total Shareholders Equity | 10.46 | 13.76 | 13.64 |
Borrowings | Nil | Nil | Nil |
Other Liabilities | 0.13 | 1.30 | 1.36 |
Total Assets | 10.59 | 15.06 | 15.00 |
Fixed Assets | 0.86 | 0.92 | 0.84 |
Investments | 0.19 | 6.64 | 4.35 |
Book Value / Share (Rs.) | 35.04 | 46.06 | 45.67 |
Chart 2: Balance Sheet Overview — FY23 to FY25 (Source: Screener.in / BSE India)
4.3 Cash Flow Statement Analysis
Operating cash flow flipped from deep negatives on weak working capital, to positive.
Investing cash positive FY22-FY23. Negative dip FY24 (-₹0.33 Cr) hit from investments, back positive FY25. Net cash positive FY23-FY25.
Cash Flow (Rs. Crore) | FY22 | FY23 | FY24 | FY25 |
Cash from Operating Activity | -2.60 | 0.60 | 0.11 | 0.59 |
Cash from Investing Activity | 0.90 | 0.44 | -0.33 | 0.09 |
Cash from Financing Activity | 1.18 | -0.40 | 0.43 | 0.41 |
Net Cash Flow | -0.52 | 0.64 | 0.21 | 1.09 |
Table 4: Cash Flow Summary — FY22 to FY25 (Source: Screener.in)
4.4 Key Financial Ratios
Ratio | FY23 | FY24 | FY25 | Observation |
|---|---|---|---|---|
ROCE (%) | 1.01% | 1.98% | 1.82% | Low but ticking up |
ROE (%) | ~0.4% | ~1.1% | ~1.9% | Very low, slow climb |
Operating Profit Margin | -6.72% | -6.86% | -6.62% | Negative (trading loses money) |
Net Profit Margin | 0.61% | 2.86% | 7.69% | Big jump in FY25 |
Debt to Equity | 0.00 | 0.00 | 0.00 | Debt-free completely |
EPS (Rs.) | 0.13 | 0.50 | 1.68 | Strong FY25 gain |
Book Value/Share (Rs.) | 35.04 | 46.06 | 45.67 | Solid; beats market price |
Working Capital Days | 224 | 136 | 62 | Much better efficiency |
P/B Ratio (approx.) | – | – | ~0.51x | Cheap vs. book value |
Table 5: Key Financial Ratios — FY23 to FY25 (Source: Screener.in / Calculated)
Ratios show mixed but improving signs. Working capital days crashed from 224 to 62 real efficiency gains. Net margin leaped to 7.69% on higher other income. Stock at ~0.51x book means buying Rs. 45.67 assets for ~Rs. 22 value play potential.
Downside: ROE/ROCE under 2%, trading ops still bleed cash consistently.
5. Key Insights and Interpretation
5.1 Strengths
Zero debt since FY23 stands out. No loan payments or default worries for a micro-cap trader are huge plus amid high rates.
Working capital days plunged from 224 FY23 to 62 FY25 smarter collections and payments. Ops cash positive three years straight FY23-FY25 after negatives.
5.2 Weaknesses
Core trading revenue keeps tanking. Top line shrinkage questions business staying power.
Trading margins are negative every year but FY21. Core ops can't cover costs. Relies 100% on other income (interest, investments) for profits, if gone, straight losses.
Promoters at 33.51% low and frozen for years. ROE under 2%, no dividends despite profits. Shareholders dropped from 5,766 (Mar 2023) to 5,421 (Dec 2025)—interest fading.
5.3 Risk Factors
Trading revenue keeps dropping.
Total reliance on other income for profits.
Liquidity risk hits investors hard. Hard to buy or sell real size without price chaos.
Governance flags from market sites. Thin disclosures and tiny scales hide what's really going on inside.
5.4 Future Outlook
Uncertain but short-term looks less grim than history. FY25 brought better EPS, margins, working capital, positive cash—some stability signs.
Real fix needs trading revenue growth. Scale up current lines or add new ones to reverse decade-long drop. No public plans show though.
Q2 FY25 sales crashed to Rs. 0.01 Cr from Rs. 1.74 Cr prior year lumpy and unpredictable. Needs steady quarters of revenue pickup before optimism.
6. Conclusion
Financials from Screener.in paint a mixed picture for Enterprise International. Positives hit hard: debt-free, growing equity, sharp working capital fixes, stock at deep book discount. FY25 EPS jump impresses.
Core issues loom large though. Revenue down 90% in a decade, stuck low. Trading bleeds cash yearly—profits ride solely on investment income. Not sustainable long-term without trading rebound.
Low static promoter stake, no dividends, sub-2% returns, fading shareholders signal weak confidence.
Value hunters might eye 0.51x P/B and recent gains. But for fundamental plays, revenue slide and non-core dependence scream high risk. Speculative turnaround bet only—know the dangers.
Data Sources
1. Screener.in — Primary source for all financial data (P&L, Balance Sheet, Cash Flows, Ratios, Shareholding)
2. BSE India — www.bseindia.com (Official filings, Annual Reports, Corporate Announcements)