DEEPAK SPINNERS LIMITED Financial Report 2025
1. Introduction
Ludhiana, Deepak Spinners Ltd was founded in 1986 and it focuses on synthetic staple fibre yarns along with blended man-made fibres for knitwear and woven textiles. Though it has traded on the BSE under DEEPAKSPIN, recent performance broke a long run of gains - FY25 brought its initial annual deficit after years of steady earnings.
Although oil price swings hit polyester and acrylic expenses, changing needs in key clothing centers - Ludhiana, Tirupur - added pressure. Looking back at finances between FY22 and FY25 reveals clear struggles, yet points toward possible rebounds. Because of these combined forces, outcomes shifted sharply; still, room remains to rebuild.
2. Company Overview
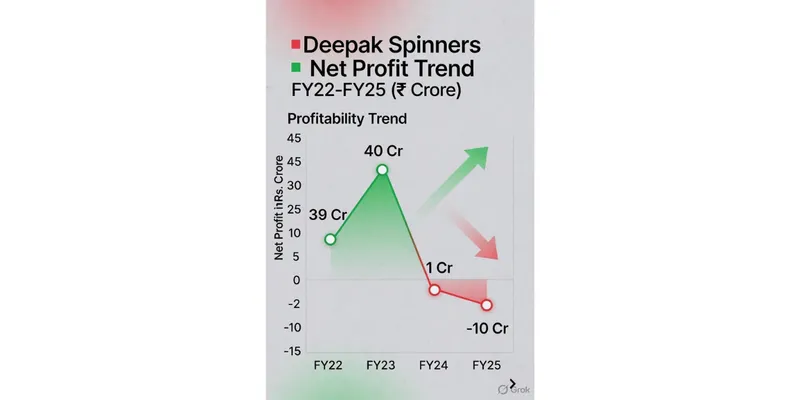
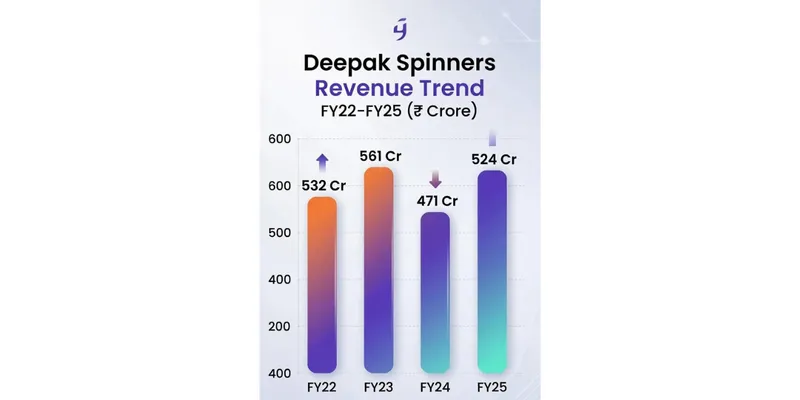
Starting in the 1980s, Deepak Spinners built its manufacturing base in Madhya Pradesh, aligning with India’s initial efforts to grow synthetic fabric production. Polyester blends come out of this plant alongside acrylic and viscose-mixed yarn types. Though focused on synthetics, the company covers several material forms. The site has stayed active since those early industrial years. A surge marked the firm’s performance in FY22 and FY23 - revenues reached Rs.532 Cr, then climbed to Rs.561 Cr, while net profits held steady at Rs.39 Cr and Rs.40 Cr. After that peak, decline hit fast. By FY24, profit plunged to just Rs.1 Cr. In FY25, results turned negative, posting a net loss of Rs.10 Cr. This steep drop demands attention. Worth examining how it unfolded.
- Products: Synthetic staple fibre yarn, man-made fibre blended yarn
- End Markets: Knitwear, hosiery, fabric manufacturers
- Production: Facility in Madhya Pradesh
- Managing Director: Yashwant Kumar Daga
3. Promoter & Management
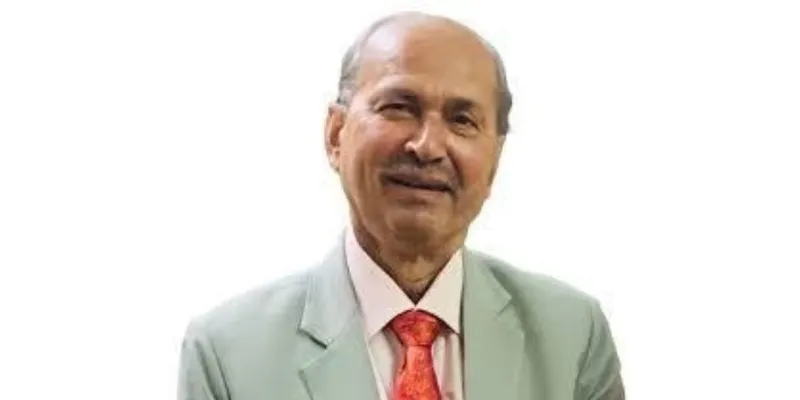
Deepak Spinners is managed by Yashwant Kumar Daga as Managing Director. The company was promoted in the 1980s with HPMIDC (Himachal Pradesh State Industrial Development Corporation) participation in the initial equity allotment — reflecting its roots as part of India's industrial development framework. The current promoter group maintains management control. Independent directors include Shounak Mitra, Satya Prakash Sarda, and Hussan Lal Sonu.
4. Financial Statement Analysis
Income Statement
A sharp turnaround emerges from the data. Exceptional results marked FY22 and FY23 - revenue surpassed Rs.530 Cr, while profits hovered around Rs.40 Cr. Following that period, however, FY24 brought steep declines: income shrank to Rs.471 Cr, alongside a dramatic drop in earnings down to Rs.1 Cr. In FY25, although sales climbed back toward Rs.524 Cr, the firm ended up losing Rs.10 Cr overall. Profitability during operations had shifted too, falling from a high of 13% two years earlier to merely 1% by FY25.
Metric (Rs. Cr) | FY22 | FY23 | FY24 | FY25 |
|---|---|---|---|---|
Revenue | 532 | 561 | 471 | 524 |
Operating Profit | 69 | 70 | 20 | 5 |
OPM % | 13% | 13% | 4% | 1% |
Net Profit (PAT) | 39 | 40 | 1 | −10 |
EPS (Rs.) | 54.65 | 55.76 | 1.81 | −14.17 |
Balance Sheet
Even with profits dropping sharply, the company reduced its debt load - debt declined from Rs.49 Cr in FY22 to Rs.37 Cr by FY25. Because of ongoing losses, reserves dipped slightly, falling from Rs.228 Cr to Rs.218 Cr as retained earnings took a hit. Over the same period, total assets shrank, moving down from Rs.353 Cr to Rs.333 Cr. Though income weakened, the financial structure shows some strengthening in liabilities.
Metric (Rs. Cr) | FY22 | FY23 | FY24 | FY25 |
|---|---|---|---|---|
Total Assets | 304 | 349 | 353 | 333 |
Equity Capital | 7 | 7 | 7 | 7 |
Reserves | 190 | 228 | 228 | 218 |
Borrowings | 49 | 50 | 44 | 37 |
Cash Flow Statement
Cash Flow (Rs. Cr) | FY22 | FY23 | FY24 | FY25 |
|---|---|---|---|---|
Operating CF | 39 | 42 | 27 | 16 |
Investing CF | −26 | −37 | −16 | −6 |
Financing CF | −13 | −4 | −11 | −10 |
Operating cash flow has declined but stayed positive even in FY25 (Rs.16 Cr) — which is actually better than the net loss number suggests. Depreciation differences and working capital movements explain the gap.
Financial Ratios
Ratio | FY22 | FY23 | FY24 | FY25 |
|---|---|---|---|---|
ROE (%) | 20% | 17% | ~0% | −4.3% |
ROCE (%) | ~20% | ~18% | ~4% | −3.7% |
Net Margin (%) | 7.3% | 7.1% | 0.2% | −1.9% |
Debt-to-Equity | 0.23 | 0.21 | 0.19 | 0.16 |
Debtor Days | 23 | 19 | 21 | 25 |
EPS (Rs.) | 54.65 | 55.76 | 1.81 | −14.17 |
5. Key Insights & Interpretation
Strengths
- Debt-to-equity ratio improving even during losses — management discipline
- Operating cash flow remained positive in FY25 despite net loss
- Stock trades at 0.33x book value — deep discount to assets
- Debtor days consistently low (19–25 days) — efficient receivables management
Weaknesses
- FY25 net loss of Rs.10 Cr — first loss year after strong FY22–23
- Operating margins collapsed from 13% to 1% — structural or cyclical is the key question
- Low interest coverage ratio — current earnings can't comfortably service debt
- Revenue growth essentially flat over 5 years (3% CAGR)
Risk Factors
- Polyester and acrylic staple fibre prices linked to crude oil — volatile input costs
- Knitwear sector demand slump in Ludhiana cluster directly impacts volumes
- Continued losses would further erode the reserve base
Future Outlook
Q3 FY26 data shows signs of margin recovery — operating profit turned slightly positive in recent quarters. If synthetic fibre prices stabilise and demand from knitwear clusters picks up, Deepak Spinners could return to profitability in FY26. The balance sheet — relatively low D/E and positive operating cash — gives the company runway to wait out the cycle.
6. Conclusion
Deepak Spinners is a cyclical company going through a cyclical trough. The fundamentals — manageable debt, strong asset base, efficient collections — haven't collapsed. But the profit reversal is sharp and the reason for margin compression isn't fully clear from public disclosures. At 0.33x book value, the stock is priced for pessimism. Recovery hinges on synthetic fibre price normalisation and a knitwear sector pickup. High risk, potentially high reward — but only for investors with a clear view on the input cost cycle.
Data Sources