Chargeurs SA

Executive Summary
Compagnie Chargeurs Invest SA is an investment holding company based in France and established back in 1872. The company carries out its operations via specialized ventures in technical textiles, luxury fibers, museum services, and new materials. Financial analysis reveals that the company witnessed a drop in its income and gross profit for FY2025. On the other hand, the company registered an increase in loss on account of its restructuring and strategic transformation initiatives. Despite challenges, the company continues with an approach to engage itself with future sustainable business development and innovation.
Company Overview
Compagnie Chargeurs Invest SA is a holding company that owns the Chargeurs Group. The group was incorporated in 1872 and has its headquarters located in Paris, France. The company is publicly traded on the Euronext Paris exchange, under the ticker code "CRI." The Chargeurs Group is structured around 3 strategic platforms, namely Fashion & Know-How, Museum Studio, and Innovative Materials. Fashion & Know-How comprises Chargeurs PCC and Luxury Fibers divisions and luxury brands such as Swaine, The Cambridge Satchel Company, and Altesse Studio. It is currently chaired and managed by CEO and Chairman Michal Fribourg.
Industry Overview
The company mainly operates in the technical textiles and luxury materials industry. It supplies products and services to the apparel, fashion, luxury, and industrial sectors. The industry is growing due to increasing demand for sustainable, high-quality, and traceable textile products. Companies are investing in advanced technologies, eco-friendly materials, and digital traceability to improve product quality and meet changing customer preferences. With its strong global presence and focus on innovation, Compagnie Chargeurs Invest is well positioned to benefit from these long-term industry trends.
Financial Performance Analysis
Particulars (€ Million) | 2024 | 2025 |
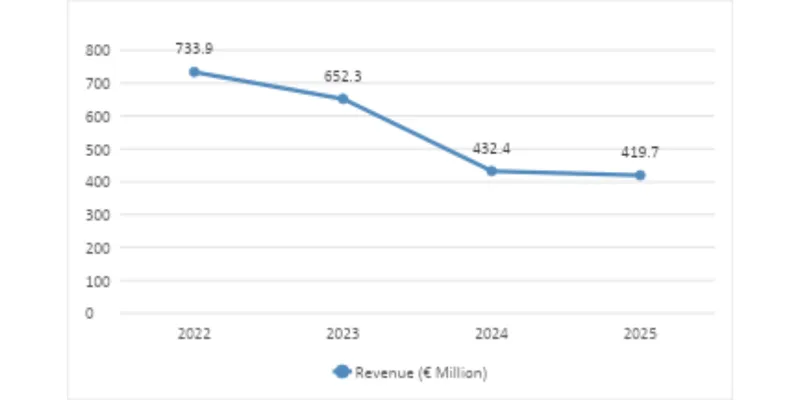
Revenue | 432.4 | 419.7 |
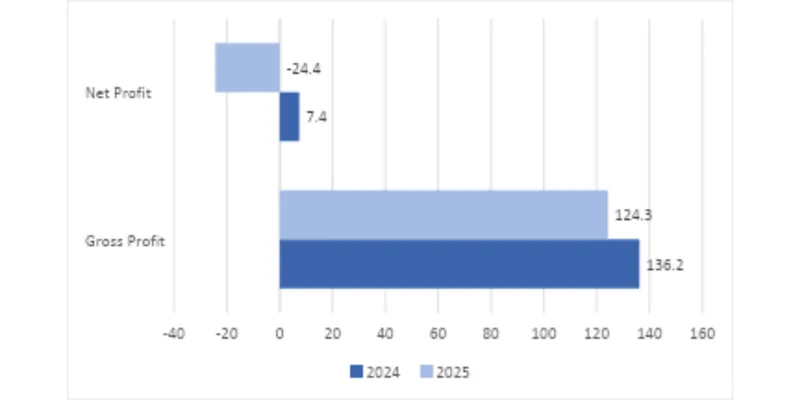
Gross Profit | 136.2 | 124.3 |
Net Profit | 7.4 | -24.4 |
4.1 Key Financial YOY
4.2 Revenue Trend Over 3-5 Years
4.3 Interpretation
The company's financial results went from strength to strength to an overall poorer performance in 2025. The company's revenue fell, showing sales for the year declined, which correspondingly caused the company to post a lower level of gross profit, meaning it is making a lower profit from operations. Furthermore, the Company announced that it has registered a net loss for 2025, the primary cause being restructuring costs and unexpected expenditures during our transition, but the Company expects to continue on its pathway of a strong, high-quality, long-term business promoting growth.
Key Financial Ratio
Ratio Category | Formula | FY 2025 | Interpretation |
Current Ratio | Current Assets / Current Liabilities | 1.41 | The company has a healthy short-term liquidity position and can comfortably meet its current obligations. |
Quick Ratio | (Current Assets − Inventory) / Current Liabilities | 1.06 | Indicates good immediate liquidity, as the company can meet short-term liabilities without relying on inventory sales. |
Gross Margin % | Gross Profit / Revenue × 100 | 29.62% | The company maintained a healthy gross margin, although it declined slightly compared to the previous year due to lower profitability from operations. |
Net Profit Margin % | Net Profit / Revenue × 100 | -5.81% | The negative margin indicates the company incurred a net loss in FY 2025, mainly due to restructuring costs and strategic transformation expenses. |
Return on Equity (ROE) | Net Profit / Shareholders' Equity × 100 | -9.95% | The negative ROE reflects a loss during the year, resulting in a negative return for shareholders. |
Debt-to-Equity Ratio | Total Debt / Shareholders' Equity | 1.52x | The increase in leverage indicates greater reliance on debt financing, leading to higher financial risk compared to the previous year. |
Inventory Turnover | Cost of Sales / Inventory | 3.95x | Inventory was managed efficiently, with faster inventory movement during the year. |
Asset Turnover | Revenue / Total Assets | 0.44x | The company generated €0.44 of revenue for every €1 of assets, indicating moderate efficiency in asset utilization. |
SWOT Analysis
Strengths | Weaknesses |
Global leader in garment interlinings and premium luxury fibers through Chargeurs PCC and Luxury Fibers. | High dependence on niche and luxury markets, which are sensitive to economic slowdowns. |
Strong focus on innovation, sustainability, and traceable products, enhancing brand value. | Higher debt levels increase financial leverage and the interest burden. |
Diversified business portfolio across Fashion & Know-How, Museum Studio, and Personal Goods. | Revenue and profitability declined in FY2025 due to restructuring and strategic transformation. |
Opportunities | Threats |
Growing demand for sustainable, premium, and traceable textile products worldwide. | Intense competition from global textile and luxury goods companies. |
Expansion of luxury brands and museum services into new international markets. | Economic uncertainty and reduced consumer spending on luxury products. |
Increasing adoption of digital technologies and ESG initiatives to improve operational efficiency. | Fluctuations in raw material prices, especially wool and other natural fibers. |
Conclusion and Recommendations
According to the financial analysis, it is evident that Compagnie Chargeurs Invest SA has incurred a marginal drop in revenue and profitability for the fiscal year 2025 owing to restructuring processes and strategic changes. Despite the net loss, the firm retained its liquidity position intact and was investing in highly valued and sustainable companies. The firm’s well-known presence in the global market, diverse business portfolio, and innovative approach are some of the factors that will enable its future growth.
References & Sources
- Compagnie Chargeurs Invest SA - Annual Report 2025
- Compagnie Chargeurs Invest Official Website
- Microsoft Excel