Chandni Machines Ltd

1.Introduction
Chandni Machines Ltd is an Indian engineering goods company that trades and distributes a range of industrial machines, including plastics and rubber machinery, metal working tools and material‑handling equipment.
Industry Overview
The company operates in the engineering goods trading market, which operates in different manufacturing markets such as automobiles, plastics, pharmaceuticals and fabrication. This industry is competitive, with small players facing margin price pressure and working capital demands.
Purpose of the Analysis
This analysis aims to understand the company’s background, business model, leadership, recent financial performance, key strengths and weaknesses, risks and future in a simple and complete manner.
2. Company Overview
Background and History
Started in 2016 and becoming a public limited company in 2018, Chandni Machines is headquartered in Mumbai. Its main business is selling imported machine tools and equipment to Indian manufacturers.
Business Model
The company earns revenue by sourcing machines from foreign vendors and selling them to buyers in India, earning trade margin and occasionally offering after sales services.
Key Products and Services
Industrial machines like injection moulding, rubber processing.
Machine tools like lathes, drills, milling.
Material handling and testing equipment.
Market Position
Chandni is a micro player in its segment.It does not have the scale of larger engineering distributors and its sales depend on demand cycle in manufacturing.
3. Promoter / Founder Introduction
Promoter/Founder
Chairman & Managing Director: Jayesh Ramniklal Mehta
Executive Director: Amita Jayesh Mehta
Jayesh Ramniklal Mehta

Professional Background
Mr. Jayesh Ramniklal Mehta is a Textile Engineer from V.J.T.I., Mumbai, with over 30 years of experience in engineering and machinery manufacturing.Jayesh Ramniklal Mehta leads the company’s strategic and operational functions, with long‑term experience in machinery trading.Amita Jayesh Mehta is involved in executive functions and contributes to governance and market outreach.
Role in Growth
The promoters lead vendor negotiations, sales strategy and inventory decisions, directly affecting revenue and profitability.They have an important part in the growth of the company’s growth.
4. Financial Statement Analysis
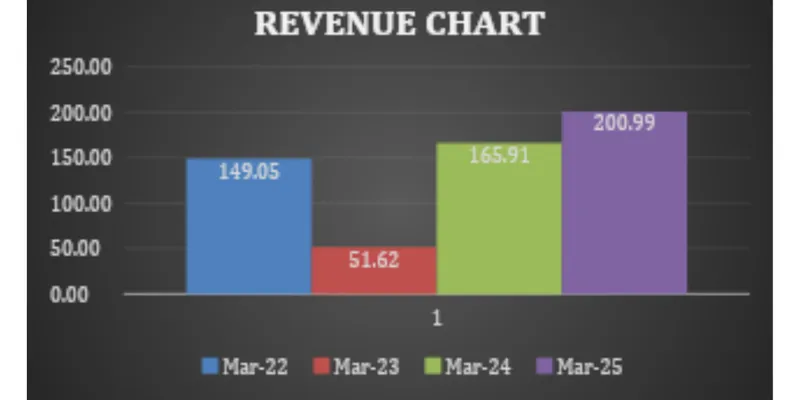
A) Income Statement Analysis (₹ Crore)
Particulars | FY 2022‑23 | FY 2023‑24 | FY 2024‑25 | Trend |
Revenue | 516.22 | 1,659 | 2,010 | Strong growth |
Revenue Growth (%) | — | +221.43% | +21.13% | very low growth |
Gross Profit | 19.02 | 54.90 | 57.16 | Gross profits increased |
Net Profit | 3.50 | 17.29 | 14.27 | Profits jumped. |
Net Profit Margin (%) | 0.68% | 1.04% | 0.71% | Margins improved . |
.
B) Balance Sheet Analysis (₹ Crore)
Particulars | FY 2022‑23 | FY 2023‑24 | FY 2024‑25 | Trend |
Equity Share Capital | 3.23 | 3.23 | 3.23 | Equity stable. |
Reserves & Surplus | 3.84 | 5.57 | 6.99 | Strong reserves. |
Total Shareholders Funds | 7.06 | 8.79 | 10.22 | Net worth rising |
Borrowings | 0.51 | 0.36 | 0.25 | Low borrowings. |
Other Liabilities | 5.04 | 7.64 | 12.00 | Liabilities increased. |
Total Assets | 12.62 | 16.80 | 22.47 | Total assets expanded |
C) Cash Flow Statement Analysis (₹ Crore)
Cash Flow Item | FY 2022‑23 | FY 2023‑24 | FY 2024‑25 |
Operating Cash Flow | 0.08 | 4.39 | 6.21 |
Investing Cash Flow | 0.00 | –1.84 | –3.12 |
Financing Cash Flow | –1.38 | –0.21 | –2.25 |
Net Cash Flow | –1.30 | 2.34 | 0.84 |
D) Key Financial Ratios (Latest Years)
Ratio | FY 2022‑23 | FY 2023‑24 | FY 2024‑25 |
Current Ratio | ~0.63 | ~0.63 | ~0.63 |
Debt/Equity | ~0.08 | ~0.08 | ~0.08 |
ROE | ~2.20% | ~2.20% | ~2.20% |
ROA | ~0.76% | ~0.76% | ~0.76% |
Operating Margin | ~1.16% (FY24) | ~0.25% (FY25) | — |
E) Year‑on‑Year Comparison (3 Years)
Aspect | FY 2022‑23 | FY 2023‑24 | FY 2024‑25 |
Revenue | ₹516.22M | ₹1,659M | ₹2,010M |
Revenue Growth | — | +221% | +21% |
Net Profit | ₹3.50M | ₹17.29M | ₹14.27M |
Net Worth | ₹7.06Cr | ₹8.79Cr | ₹10.22Cr |
Operating Cash Flow | 0.08Cr | 4.39Cr | 6.21Cr |
Total Assets | ₹12.62Cr | ₹16.80Cr | ₹22.47Cr |
5. Key Insights & Interpretation
Strengths
Revenue increased in FY25, showing improved sales activity which is a very positive point.
Presence in multiple industrial markets gives wide revenue sources.
Weaknesses
Profit margins remain weak and inconsistent.
Quarterly operations have shown volatility, including periods of low sales.
Risk Factors
Demand fluctuations in engineering goods can greatly affect sales.
Working capital requirements are high due to inventory and receivables.
Competitive pressure from distributors may limit growth.
Future Outlook
Improvement in manufacturing demand and a consistent order pipeline could support growth. Recovery in recent quarterly performance suggests potential stability if momentum continues.
6. Conclusion
Financial Health
Chandni Machines Ltd shows moderate revenue growth but weak profit. Financial health appears sensitive due to inconsistent earnings and competitive industry challenges.
Performance Perspective
For long‑term investors, the company carries risk due to margin pressure and demand sensitivity. Short‑term investors may see opportunities if operational consistency strengthen
7.DATA SOURCES
https://www.screener.in/company/542627/