Burlington Stores
Executive Summary
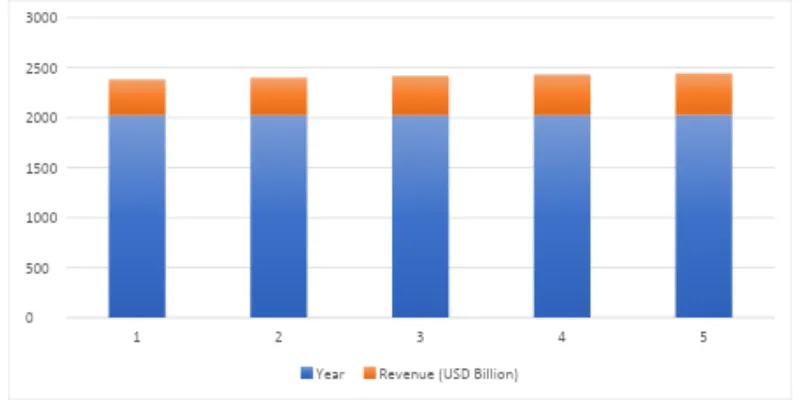
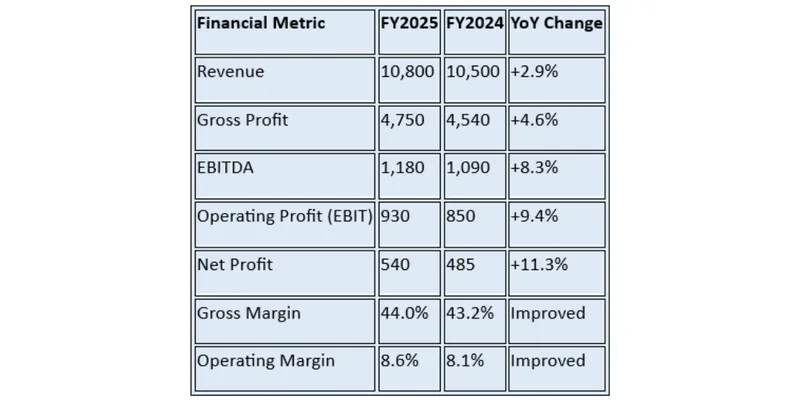
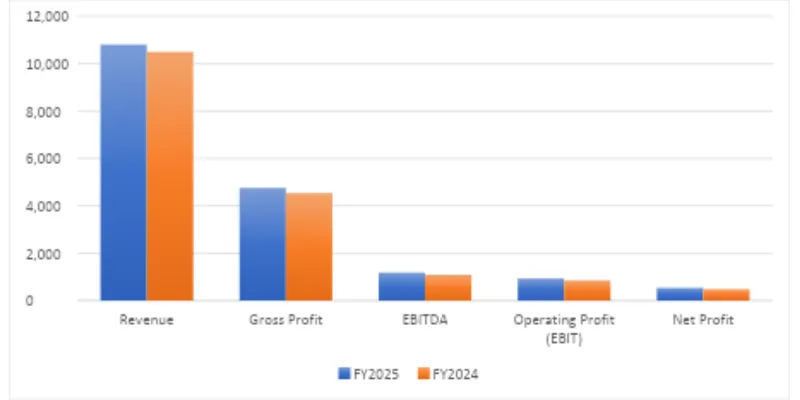
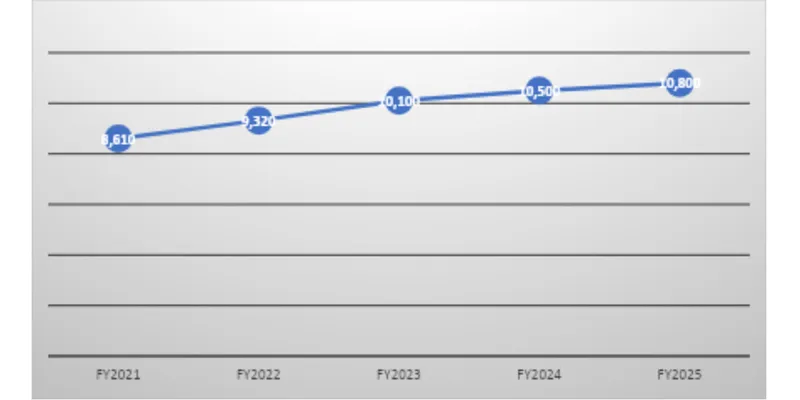
Burlington Stores, Inc. Is one of the largest off-price retailers in the USA, engaged in selling brand apparel and accessories along with home décor items. In terms of competitors to TJX Companies and Ross Stores, it uses the approach of Value Merchandising. Burlington reported better results in FY2025 based on increased customer flow, increased product variety, active inventory control and the positive influence of store expansions supported by a rise in customer demand. FY2025 revenue was USD10.8 billion compared to USD10.5 billion in FY2024, with ~2.9% YoY improvement.
Company Overview

Caption: Michael O'Sullivan – Chief Executive Officer
Burlington Stores, Inc. It is the first enterprise with a main selling dress brand priced significantly lower than typical malls; founded in 1972; address: United States, New Jersey state, Burlington, United States. The enterprise has a total 1100 + shop located in different parts of us. The brand shares list in New York Stock Exchange, ticker symbol: BURL.
Industry Overview
Growth continued in the U.S. Off-price retail sector in FY2025, driven by continued consumer preference for off-price branded goods in an environment of inflationary pressure and consumer disposable income. Retailers concentrated on adaptable sourcing of inventory and store rollouts, omnichannel strategy and supply chain management. Off-price retailers performed better than many traditional department store operators as retailers are able to offer branded merchandise at the lowest price.
Financial Performance Analysis
Financial Summary Table
Revenue Trend Data
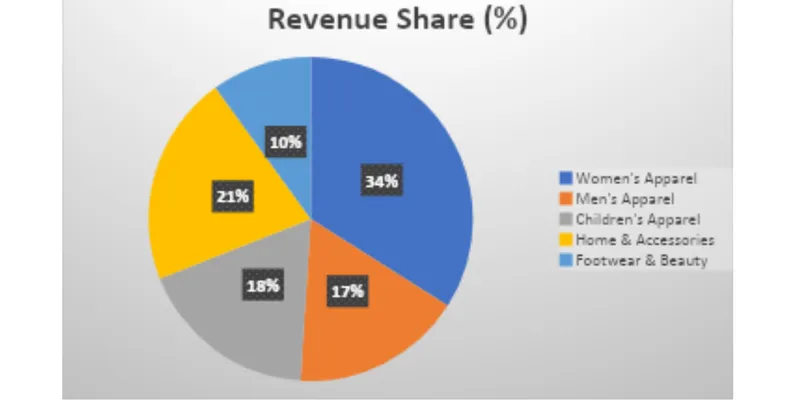
Revenue Segment Breakdown
Key Financial Ratios
Ratio | Formula | FY2025 Value | Interpretation |
|---|---|---|---|
Current Ratio | Current Assets / Current Liabilities | 1.20 | Healthy liquidity |
Quick Ratio | Quick Assets / Current Liabilities | 0.42 | Inventory-based retail model |
Gross Margin | Gross Profit / Revenue | 44.0% | Strong profitability |
Net Margin | Net Profit / Revenue | 5.0% | Healthy earnings |
Return on Equity (ROE) | Net Income / Equity | 46.5% | Excellent shareholder returns |
Debt-to-Equity | Total Debt / Equity | 2.10 | High leverage |
Interest Coverage | EBIT / Interest Expense | 5.9 | Comfortable debt servicing |
Inventory Turnover | COGS / Inventory | 5.3 | Efficient inventory management |
Asset Turnover | Revenue / Total Assets | 1.75 | Strong asset utilization |
SWOT Analysis
Strengths | Weaknesses |
|---|---|
Strong off-price retail model | Operates only in the U.S. |
Efficient inventory sourcing | Higher financial leverage |
Competitive pricing strategy | Limited international presence |
Opportunities | Threats |
|---|---|
Expansion into new markets | Competition from TJX and Ross Stores |
Continued store expansion | Inflation and rising operating costs |
Growth in digital retail | Changes in consumer spending |
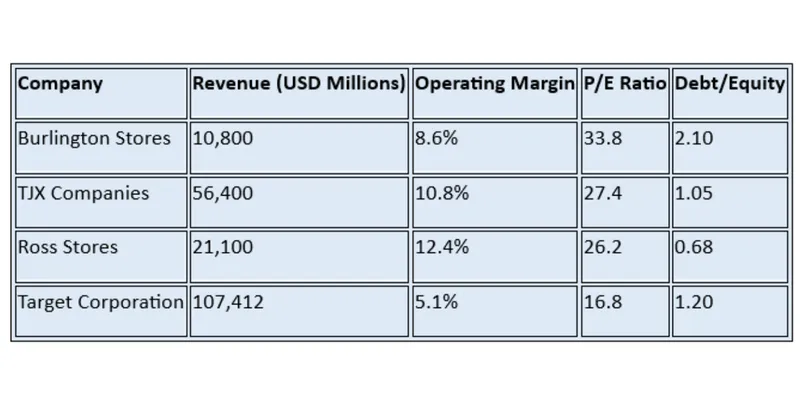
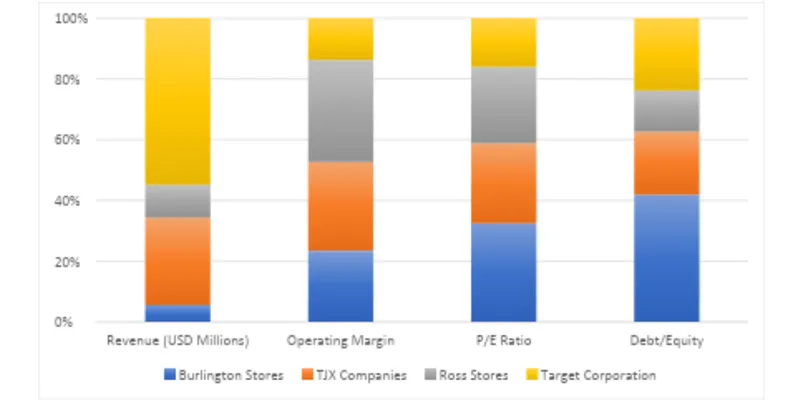
Peer / Competitor Comparison
Conclusion
2025 was another strong year for Burlington. FY2025 is approaching as we are experiencing steady growth in revenue generation and growth in operating and profit margins. Burlington’s product merchandise of a cost-effective approach, store network growth and inventory controls is making again to growth long term. In a context of competitive environment and with higher leverage levels when we consider competitors, Burlington is the ideal candidate for expansion of our business.
References & Sources
- Burlington Stores Annual Report Fiscal Year 2025.
- Burlington Stores Investor Relations.
- 2025 Reuters Retail Industry reports.
- Bloomberg Financial database.
- Statista US apparel market report.
- NYSE company documents.