“Analysing the Financial Report of Amarjothi Spinning Mills Ltd”
1. Introduction
Amarjothi Spinning Mills Ltd was incorporated in 1987 in Tamil Nadu and has spent nearly four decades making colour melange yarn for India's readymade garment industry. The Amarjothi Group formally took shape around 1992 with a clear focus on the export-linked garment supply chain. It also runs windmill power generation — a secondary line that meaningfully cuts operating costs.
India's textile spinning sector contributes roughly 2% to national GDP and employs upwards of 45 million people. It's a competitive, margin-thin business where raw material prices and energy costs make or break quarterly results. That's the backdrop for reading Amarjothi's numbers.
This report covers FY2022 through FY2025, analysing revenue trends, profitability, balance sheet health, and the overall investment case for a general reader.
2. Company Overview
The core business is asset-heavy and commodity-driven: convert cotton and polyester into specialised yarn, sell it to garment makers. Colour melange yarn — Amarjothi's niche — is used in T-shirts, knitwear, and casual wear. The wind power operation runs alongside, generating captive electricity that reduces per-unit costs.
The company doesn't compete on scale with sector giants like Vardhman Textiles or RSWM. But in the melange niche, it holds an established position with loyal buyers. The client base is largely domestic garment manufacturers and export-oriented units in Tamil Nadu.
- Key Products: Colour melange yarn, blended yarn, open-end spun yarn
- Secondary Revenue: Captive wind power generation
- Market Position: Regional mid-size player with niche specialisation in melange yarn
- Listed: NSE: AMARJOTHI | BSE: 521097
3. Promoter & Founder
Rajan Premchander, serving as Chairman and Managing Director. Steering initial growth, he prioritised colour melamine yarn - a niche demanding exacting standards alongside deep client ties. Rather than chase rapid expansion, his method leans on caution: consistent machine usage, tight expense control, self-generated energy supply, while avoiding heavy borrowing. Ownership remains concentrated, with promoters retaining close to 60 percent - this signals enduring belief in the business, yet simultaneously narrows market availability and share turnover.
4. Financial Statement Analysis
Income Statement
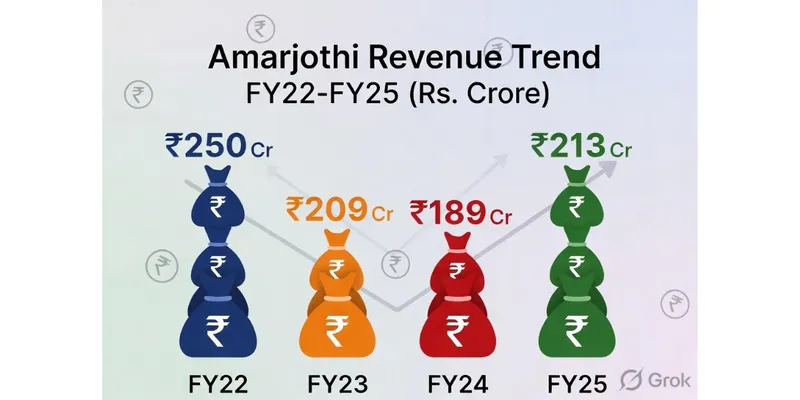
FY22 was Amarjothi's strongest year recently — revenue reached Rs.250 Cr on post-COVID demand recovery. Since then, it slipped to Rs.209 Cr in FY23 and further to Rs.189 Cr in FY24, before recovering to Rs.213 Cr in FY25. Operating margins, notably, stayed consistent at 14–15% throughout — which tells you the cost structure held even as topline wavered.
Metric (Rs. Cr) | FY22 | FY23 | FY24 | FY25 |
|---|---|---|---|---|
Revenue | 250 | 209 | 189 | 213 |
Operating Profit | 34 | 30 | 29 | 31 |
OPM % | 14% | 14% | 15% | 15% |
Net Profit (PAT) | 21 | 10 | 8 | 11 |
EPS (Rs.) | 31.24 | 15.01 | 11.88 | 16.36 |
Balance Sheet
This is genuinely the most reassuring part of the Amarjothi story. Borrowings fell from Rs.87 Cr in FY22 to Rs.52 Cr by FY25 — roughly 40% debt reduction in three years. Reserves climbed from Rs.159 Cr to Rs.183 Cr. The company is getting financially cleaner even without growing much on the topline.
Metric (Rs. Cr) | FY22 | FY23 | FY24 | FY25 |
|---|---|---|---|---|
Total Assets | 279 | 258 | 282 | 274 |
Equity Capital | 7 | 7 | 7 | 7 |
Reserves | 159 | 168 | 174 | 183 |
Borrowings | 87 | 58 | 65 | 52 |
Cash Flow Statement
Cash Flow (Rs. Cr) | FY22 | FY23 | FY24 | FY25 |
|---|---|---|---|---|
Operating CF | 16 | 28 | 3 | 24 |
Investing CF | -30 | 10 | -3 | 2 |
Financing CF | -7 | -35 | -1 | -23 |
FY24 was a lean year for cash generation — just Rs.3 Cr from operations. FY25 bounced back sharply to Rs.24 Cr. Negative financing cash flows in FY25 reflect active debt repayment, which is exactly what you want to see.
Key Financial Ratios
Ratio | FY22 | FY23 | FY24 | FY25 |
|---|---|---|---|---|
ROE (%) | 12% | 6% | 5% | 6% |
ROCE (%) | 11% | 9% | 9% | 10% |
Net Margin (%) | 8.4% | 4.8% | 4.2% | 5.2% |
Debt-to-Equity | 0.52 | 0.33 | 0.36 | 0.27 |
Debtor Days | 52 | 61 | 108 | 59 |
EPS (Rs.) | 31.24 | 15.01 | 11.88 | 16.36 |
5. Key Insights & Interpretation
Strengths
- Consistently profitable across FY22–FY25 — no year slipped into a loss
- Debt reduction: Borrowings down from Rs.87 Cr to Rs.52 Cr; D/E improved from 0.52 to 0.27
- Captive wind power lowers energy costs — a structural, sustainable advantage
- Debtor days improved sharply: 108 days (FY24) to 59 days (FY25)
- Stock at 0.42x book value — meaningful margin of safety on asset basis
Weaknesses
- Revenue growth essentially flat over 10 years (1% CAGR) — no scale expansion
- ROE of 6% is well below a reasonable cost of equity — subtle value erosion
- Net margins thin at ~5% — any input cost shock quickly hits the bottom line
- Low analyst coverage and liquidity — typical small-cap textile risks.
Risk Factors
- Cotton and polyester price volatility directly compresses margins
- Export demand slowdowns in global apparel quickly reduce yarn offtake
- Electricity tariff hikes could offset the wind power cost advantage.
Future Outlook
Stability seems to have returned by FY25, with revenue reaching Rs.213 Cr alongside Rs.24 Cr in operating cash, following a sluggish performance in FY24. Yet future gains may depend less on internal efficiency and more on either scaling up production or broadening offerings - moves absent from present disclosures. Without such steps, the outlook for FY26 leans toward steady but limited profit margins instead of marked upward movement.
6. Conclusion
Amarjothi is a textbook value play in India's small-cap textile space: conservative management, improving balance sheet, consistent profitability, and a stock price sitting significantly below book value. It won't double its revenue quickly. But for investors who value financial discipline over growth narratives, the stock offers a reasonable margin of safety at current valuations. The company scores well on financial health and poor on growth — worth knowing which lens you're investing through.
Data Sources
- Screener.in: https://www.screener.in/company/AMARJOTHI/
- BSE India :-https://www.bseindia.com
- Amarjothi Group Official: https://amarjothi.net