“Analysing the Financial Performance of Veekayem Fashion And Apparel Ltd”

1. Introduction
Veekayem Fashion and Apparels Limited operates out of Mumbai, rooted in textiles. Despite size, India's clothing sector wrestles with unstable material costs - even as local appetite grows alongside policy support. Through verified records from fiscal year 2024–25, scrutiny turns toward how firm finances stand - and where expansion might unfold.
2. Company Overview
Background: Established in 1985 And listed under NSE & BSE.
Business Model: Manufactures and trades in grey fabric, yarn, processed textiles and garments.
Key Products: 🡪Synthetic & natural fabrics
🡪Ready-made garments.
Market Position: Small-cap player with strong promoter holding (73.6%).
3. Promoter / Founder Introduction
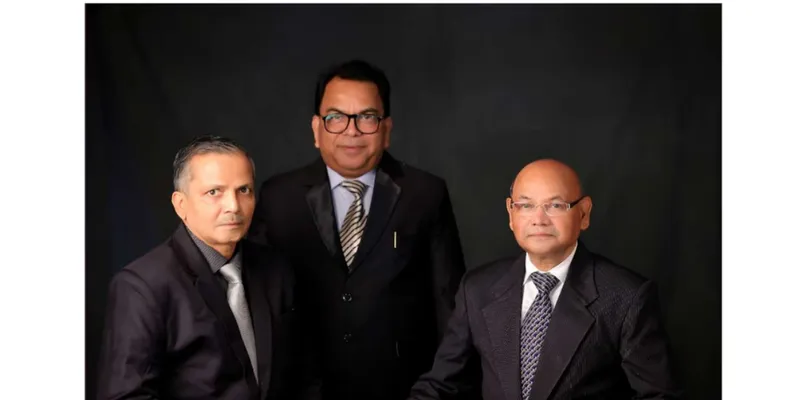
Promoters: Leading figures include Mr. Krishankant Tarachand Gupta, serving as Chairman and Managing Director. Alongside him are Mr. Vijaykumar Gupta and Mr. Madanlal Gupta, contributing to key roles within the organization
Background: They have over 40 years of textile industry experience.
Role:-Steering operations, the shift unfolded from a privately held firm into one publicly traded. Growth in income followed - consistent, measured. Oversight during transition ensured stability amid changing ownership structures.
_____________________________________________________________
-----------------------------------------
-----------------------------------------
_____________________________________________________________
4. Financial Statement Analysis
Income Statement
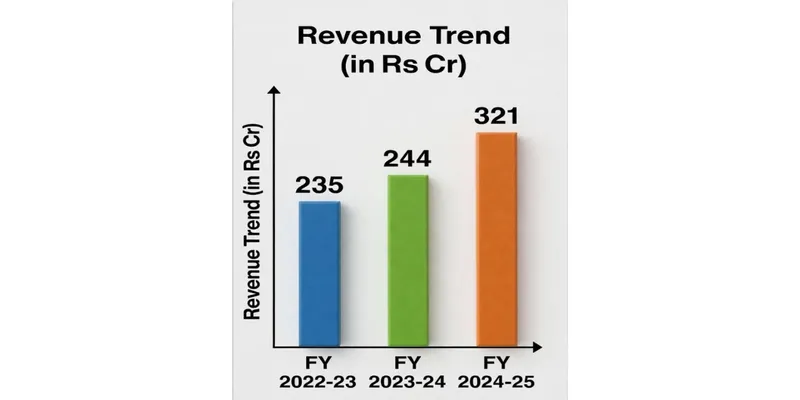
- Revenue rose from ₹235 Cr (FY23) → ₹244 Cr (FY24) → ₹321 Cr (FY25) (+31.6%).
- Net Profit also increases significantly from ₹2 Cr → ₹4.03 Cr → ₹7.64 Cr (+90%).
- EPS rose till ₹13.01.
“Strong growth in top-line and bottom-line.”
Revenue Trend Chart
Balance Sheet
- Total Assets: ₹206.30 Cr (FY25) vs ₹155.44 Cr (FY24).
- Equity: ₹56.08 Cr.
- High short-term borrowings (₹103.59 Cr).
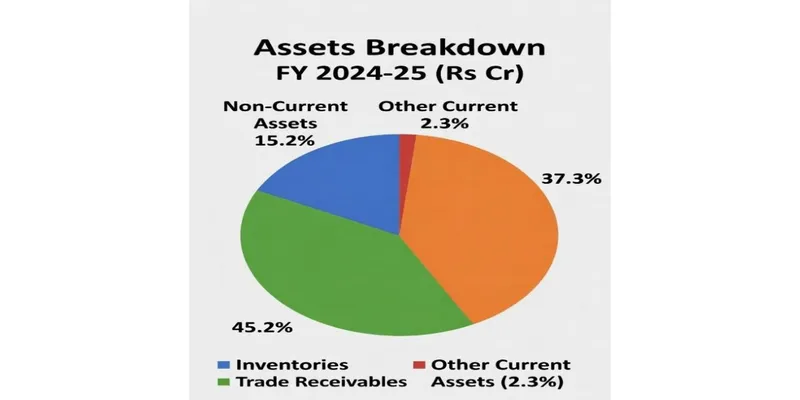
- Inventories ₹76.92 Cr,
- Receivables ₹93.15 Cr.
Balance Sheet Summary Chart (FY25 Assets)
Cash Flow
- Operating cash: -₹3.40 Cr (Because of high receivables than inventory).
- Investing outflow was around ₹9.10 Cr .
- Financing inflow likely to be ₹12.64 Cr.
- Cash balance falls low at ₹0.30 Cr(↓).
Key Ratios
Ratio | FY25 | FY24 | Change |
|---|---|---|---|
Current Ratio | 1.26 | 1.28 | -2% |
Net Debt/Equity | 19.02 | 16.25 | +17% |
ROE | 15.7% | 10.2% | ↑ |
Net Profit Margin | 2.38% | 1.65% | +44% |
ROCE | 17.9% | 14.5% | +23% |
5. Key Insights & Interpretation
Strengths:
There has been seen a rise in sales by 31.6 percent fuels higher earnings, while returns on equity and capital edge upward. Inventory moves faster through operations, signalling tighter control over stock levels
Weaknesses:
Heavy reliance on borrowed funds combines with shrinking profit margins. Cash generated from daily operations fails to cover expenses. Profitability remains under pressure due to minimal returns per sales.
Risks:
Fluctuations in raw material costs emerge alongside mounting debt levels. Receivables continue piling up over time. Financial pressure grows when suppliers raise prices unexpectedly. Borrowing more becomes common under such strain. Cash flow tightens as customer payments slow down.
Outlook:
Despite headwinds, expansion seems likely to persist. Momentum in manufacturing may carry forward. Textiles could remain a steady contributor.
6. Conclusion
Varying signs point upward for Veekayem, as financial metrics brighten across a three-year stretch. Though debt levels raise eyebrows, support from company founders adds stability. Favourable market conditions help too, nudging the outlook into optimistic territory - just not without some caution. Growth-focused individuals might see value here, provided they weigh risks carefully.
Data Sources:
- 40th Annual Report 2024-25,
- Screener.in,
- Moneycontrol.com .