“Analyse Financial Performance Of Surat Trade And Mercantile Ltd”

- Introduction
Surat Trade and Mercantile Limited focuses on commodities and portfolio assets. Once known as Surat Textile Mills Limited, the company trades publicly on the BSE. Infrastructure expansion across India fuels demand within the raw material market. Price swings in global markets also create openings for traders. Through examining results from fiscal years 2023–2024 and 2024–2025, insight emerges into stability and value trends.
Company Overview
Incorporated in 1945, its current work centers on silver and copper trade without borrowing, while also investing in mutual funds plus alternative investment vehicles. Most earnings stem from business activities rather than financial gains. Holding steady in a specialized market role, it reports promoter ownership at 68.45%, backed by an entirely debt-free balance sheet.
- Promoter / Founder Introduction
With around 65% ownership, Alok P. Shah serves as Managing Director while Suhail P. Shah holds the role of Whole-time Director. Coming from a background shaped by an MBA at Stanford and the University of Chicago, Alok contributes deep knowledge in finance. With a Ph.D. in Chemistry, Suhail brings sharp analysis into play. Because of their direction, the shift toward trading emerged alongside steady profit gains.
Financial Statement Analysis Income Statement Analysis (₹ in Lakhs):
Income Statement (₹ in Lakhs):
- Revenue grew from 6,056 in FY24 to 6,864 in FY25.(which is around 13.3% surge).
- Total income rose to 8,346 (which is approx. 4.3% ↑)
- Net profit after tax increased from 907 to 1,166 which is around 28.5% ↑ .
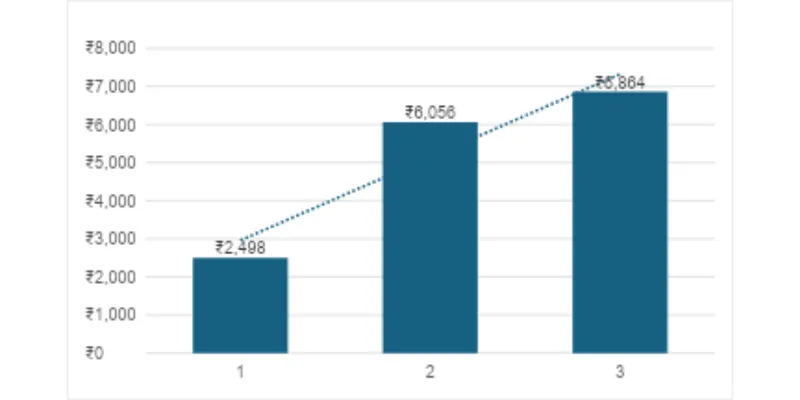
Growth comes from increased trading activity, though uneven results elsewhere pulled it back - other income dipped during FY25 as markets shifted. A tax benefit that year lifted net earnings noticeably.
Balance Sheet Analysis:
- Total Assets rose from ₹21,160 (FY24) to ₹22,092 (FY25).
- Non-current investments surged to ₹7,781 (from ₹5,339).
- Equity strengthened to ₹19,463 (from ₹18,297) via retained earnings. Liabilities fell sharply
- Non-current: ₹313 from ₹540 & Current: ₹96 from ₹102) with zero borrowings.
Cash Flow Statement Analysis:
- Still burning cash from operations - figures show minus 872 in FY25, down from a worse minus two thousand three hundred nineteen the prior year. Pressure came from shifts in how money moves through the business, stock levels playing a big part. Not much relief seen on that front just yet.
- Money came in fast because bonds and investments were cashed out - 925 million this year, 2,367 last. That’s where most of the gain showed up.
- Cash flow took a hit, down 42 in FY25. Still, net cash climbed to ₹101, up from ₹90, keeping funds afloat.
Key Financial Ratios:
- Profitability: Net Profit Ratio rose to16.99% (FY25) from 14.98% (FY24) and ROE 5.53% 🡨 4.52%; ROCE 4.33% vs 6.64%.
- Liquidity: Current Ratio maintained well from 92.75 to 103.62 (strong).
- Leverage: Debt Service Coverage 23.31 vs 59.87 (no debt).
- Last time around, inventory moved faster - 4.26 turns instead of 2.03. Even with a dip in return on capital employed, earnings have climbed. No debt means fewer worries when times shift.
5.Key Insights & Interpretation
Strengths:
A clean slate when it comes to debt. Money flows in from different directions - markets, stakes in companies. The foundation underneath? Solid ownership value holding things steady. When swings hit, safeguards soften the blow.
Weaknesses:
When a business spends more than it earns, trouble follows. Cash from daily operations dips below zero. Outside money fills gaps - unpredictable at best. Income swings wildly when tied to market shifts. Commodity values rise then fall without warning. Stability fades under such pressure. Reliance grows on sources beyond control.
Risk Factors:
Fears spread when nations argue. Taxes on imports reshape trade flows. Markets react sharply to shifts in raw material costs. Rules shift without warning.
Future Outlook:
Good signs show up in India's economy. Growth ticking at 6.5 percent sets a steady pace. Rural areas are buying more, which adds momentum. Trade deals open new doors. Silver and copper bring fresh possibilities. High-return funds get extra attention now. Gold markets offer room to move. Returns gain strength from these shifts.
6.Conclusion
Beginning with solid results, Surat Trade and Mercantile Limited shows steady income gains alongside restored profits. Without any debt burden, its balance sheet remains clean. Liquidity stands firm, supporting operational flexibility. Leadership by promoters has steered the company into commodity trading, shaping a reliable path forward. Within India’s growing economic environment, room for expansion exists. Yet fluctuations in commodities call for careful watching. Holding the stock appears sound over extended periods.
Data Sources:
- Annual Report 2024-25 (stml.in)
- BSE filings
- Livemint financial database.
- www.tickertape.in
- http//:www.stml.in