Aananda Lakshmi Spinning Mills Limited
1. Introduction
Aananda Lakshmi Spinning Mills Limited (AANANDALAK) lists on BSE and NSE as a micro-cap, incorporated March 21, 2013 in Secunderabad, Telangana. Badrinarayan Agarwal promoted it as a cotton yarn spinner. Peaked FY14–15 with Rs. 98–110 crore sales.
Now runs residual yarn making (discontinued per Jan 2026 BSE note) and real estate land plotting and sales in Telangana. Real estate fueled 'other income' and profits FY22–24. Yarn barely brought cash; land sales helped cut debt.
This Report checks the background, promoters and financials of the company.
2. Company Overview
Background and History
Aananda Lakshmi set up in March 2013 in Hyderabad with a Nalgonda, Telangana spinning plant. Over 25,000 spindles made combed, semi-combed, carded, melange, gassed, doubled, slub, fancy yarns for sportswear, innerwear, sweaters, socks, casuals. FY14 revenue topped Rs. 110 crore. FY15 on, sales crashed from industry issues, debt costs, ops problems.
Business Pivot — Real Estate
FY18–23, turned Nalgonda land into real estate stock for plotting/sales. Pumped other income: Rs. 3.60 crore FY22, 5.57 FY23, 2.78 FY24. Kept profits afloat despite weak yarn sales. Debt dropped Rs. 39.51 crore FY17 to 13.28 FY25.
Spinning Division Discontinued — January 2026
Jan 30, 2026 BSE filing with Q3 FY26 results: spinning shut down. Wrote off Rs. 3.64 crore exceptional loss. Accumulated losses Rs. 37.78 crore as of Dec 31, 2025. March 19, 2026 MSEFC claimed Rs. 22,000 for late MSME payment—small flag.
3. Promoter Introduction
Promoters locked at 58.67% since FY17 through Dec 2025 with no sales, no pledges. A Good sign. Key promoters/directors:
Name | Designation | Note |
|---|---|---|
Badrinarayan Agarwal | Chairman & MD | Founder Agarwal family; since 2013 |
Shashi Bala Agarwal | Director | Family member |
Rohit Agarwal | Director | Family member |
Rajesh Surana | Independent Director | Non-executive independent |
Chandra Sekhar Sethuram | Independent Director | Non-executive independent |
Table 1: Promoters and Directors
58.67% stake rock solid. Zero pledging ever. Agarwals stuck through stress and debt fixes a big governance plus point. Core ops are still not profitable though.
4. Financial Statement Analysis
4.1 Income Statement (FY22–FY24)
Ops revenue fell from Rs. 4.78 crore FY22 to 0.21 FY23, ticked up to 2.10 FY24. Ops loss -0.82 crore FY22, -0.19 FY23; profit 1.45 crore FY24 (69% OPM). Net profits 1.31, 5.01, 4.08 crore. Mostly other income from land sales: 3.60, 5.57, 2.78 crore. Interest down 1.12 to 0.03 crore with less debt. No dividends were paid.
Particulars (Rs. Crore) | FY22 | FY23 | FY24 |
|---|---|---|---|
Revenue (Sales) | 4.78 | 0.21 | 2.10 |
Total Expenses | 5.60 | 0.40 | 0.65 |
Operating Profit/(Loss) | -0.82 | -0.19 | 1.45 |
OPM % | -17.2 | -90.5 | 69.0 |
Other Income (land etc.) | 3.60 | 5.57 | 2.78 |
Interest | 1.12 | 0.33 | 0.03 |
Net Profit | 1.31 | 5.01 | 4.08 |
EPS (Rs.) | 3.74 | 14.32 | 11.66 |
Table 2: Income Statement — FY22 to FY24 (Source: Screener.in)
Profits from land, not yarn ops.
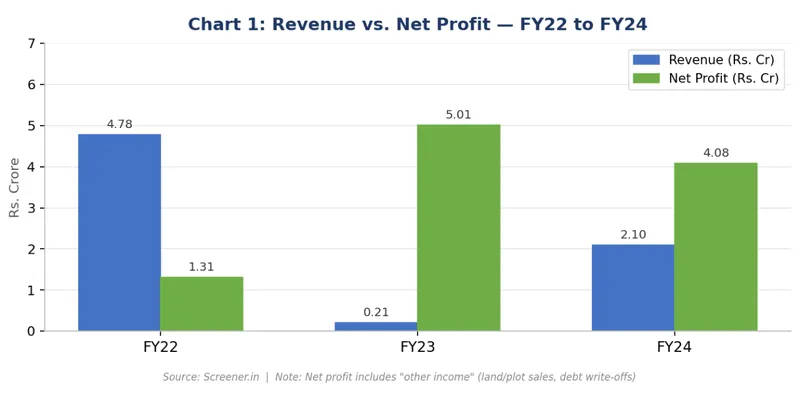
Chart 1: Revenue vs. Net Profit — FY22 to FY24
4.2 Balance Sheet (FY22–FY24)
Assets dipped Rs. 12.54 crore FY22 to 9.90 FY23, climbed to 13.35 FY24 land stock boosted it. Key win: debt down Rs. 27.63 to 19.89 crore (13.28 FY25) over Rs. 14 crore cut in four years. Fixed assets shrank 6.12 to 1.80 crore; spinning gear depreciated or sold. Reserves still bad -31.03 to -21.94 crore, book value -49.7/share. Net worth -27.5 to -18.4 crore.
Particulars (Rs. Crore) | FY22 | FY23 | FY24 |
|---|---|---|---|
Equity Capital | 3.50 | 3.50 | 3.50 |
Reserves (accum. loss) | -31.03 | -26.02 | -21.94 |
Borrowings | 27.63 | 23.41 | 19.89 |
Other Liabilities | 12.44 | 9.01 | 11.90 |
Total Assets | 12.54 | 9.90 | 13.35 |
Fixed Assets | 6.12 | 2.32 | 1.80 |
Book Value/Share (Rs.) | ~ -78.7 | ~ -64.3 | ~ -52.7 |
Table 3: Balance Sheet Summary — FY22 to FY24 (Source: Screener.in)
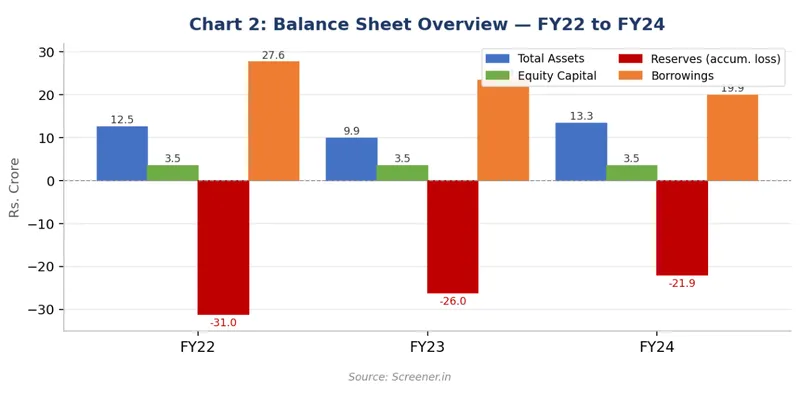
Chart 2: Balance Sheet Overview — FY22 to FY24
4.3 Cash Flow
Ops cash positive FY22 (+Rs. 2.33 crore) and FY24 (+2.54 crore) from yarn and land collections. FY23 tanked at -5.96 crore. FY25 peaked +6.92 crore, mostly land sales. Investing cash in from asset sales: 5.26 crore FY23, 1.16 FY24. Financing outflows -3.69 FY24, -6.80 FY25 show real debt paydown, the best trend here.
Cash Flow (Rs. Crore) | FY22 | FY23 | FY24 |
|---|---|---|---|
Operating | 2.33 | -5.96 | 2.54 |
Investing | 1.99 | 5.26 | 1.16 |
Financing | -4.45 | 0.72 | -3.69 |
Net Change | -0.12 | 0.02 | 0.00 |
Table 4: Cash Flow Summary — FY22 to FY24
4.4 Key Ratios
Ratio | FY22 | FY23 | FY24 | Observation |
|---|---|---|---|---|
ROCE % | -16.4% | 193.9% | 510.3% | Crazy low base |
OPM % | -17.2% | -90.5% | 69.0% | Finally positive |
Debtor Days | 148 | 1,356 | 104 | All over the place |
Cash Conv. Cycle | -203 | 1,356 | 104 | Settling down |
EPS (Rs.) | 3.74 | 14.32 | 11.66 | Land money |
Promoter Holding | 58.67% | 58.67% | 58.67% | Locked in |
Book Value/Share | ~ -78.7 | ~ -64.3 | ~ -52.7 | Less negative |
Table 5: Key Financial Ratios — FY22 to FY24
5. Key Insights and Interpretation
Profits Are Real Estate Gains, Not Business Recovery
Net profits 1.31 Cr FY22, 5.01 FY23, 4.08 FY24. Land sales 3.60, 5.57, 2.78 Cr. Yarn barely worked; ops lost money two years later.
Debt Reduction — The Genuine Positive
Debt down Rs. 41.88 Cr FY19 peak to 19.89 FY24, 13.28 FY25- 28 Cr gone via land cash. FY25 financing outflow -6.80 Cr keeps it going. Debt-free in 2-3 years possible.
Spinning Discontinued — January 2026
Jan 30, 2026 BSE note killed spinning division, wrote off Rs. 3.64 Cr. Now pure real estate—Nalgonda land plotting. Big shift. Land stock enough to finish debt payoff.
Future Outlook
All bets on leftover land and sale prices. FY25 +6.92 Cr ops cash, 3.09 Cr profit says sales active. Clear losses (37.78 Cr Dec 2025) and debt, book value turns positive eventually. But Rs. -49.7 book vs. Rs. 10.1 stock, paying land premium now.
6. Conclusion
Aananda Lakshmi shifted from spinning to land sales wind-down. FY22-24 profits 1.31-5.01 Cr from plots, not yarn. Spinning dead Jan 2026. Positives: 28 Cr debt cut since FY19, 58.67% promoters steady no pledge, clear liability plan.
Red flags real: -49.7 book value, 37.78 Cr losses, no core business, land-dependent. Post-land, No model. Orderly exit, not growth story.
Sources:
1. Screener
2. BSE