Cloth Production in India – A Sector Analysis
Author : Prof N.S. Kazi, MA – Economics, Asst. Professor & Head Corporate Relations, Ex Sasmira Professor
Introduction Textile industry is one of the oldest & largest industries in India. Apart from providing one of the basic necessities of life, the industry also plays a pivotal role through its contribution to industrial output, employment generation & export earnings. It contributes about 14% to industrial production, 4% to GDP and 17% to export earnings. It provides direct employment to over 35 million people, the second largest provider of employment after agriculture. Thus, the growth & all-round development of this industry has a direct bearing on the improvement of the economy of the nation. The Indian textile industry is extremely varied with the hand spun & hand woven sectors at one end of the spectrum & the capital intensive sophisticated mill sector at the other. The industry consists of organised as well as unorganised sectors like power loom, handloom, and hosiery. This provides the industry with the capacity to provide a large variety of products suitable to the different segments of the market both within the country & outside the country.
Installed Capacity The installed capacity in terms of spindles, looms and fibre and filament production can be seen as below:
| Items | Unit | 2001-02 | 2010-11 | CAGR % |
| Spindles | Million Nos. | 38.33 | 43.06 | 1.3 |
| Rotors | Lakh No. | 4.8 | 7.07 | 4.4 |
| Looms (organised Sector) | Lakh No. | 1.41 | 0.57 | -9.57 |
| Power Loom | Lakh No. | 16.66 | 22.61 | 3.45 |
| Man-Made Fibre | Million kg | 1090 | 1763.1 | 5.49 |
| Man-Made Filament | Million kg | 1135 | 2188.2 | 7.57 |
It can be seen from the table that the number of spindles increased from 38.33 million in 2001-02 to 43.06 million in 2010-11. The CAGR is 1.3%. The number of rotors increased from 4.8 lakh to 7.09 lakh. The number of looms in the organised sector decreased from 1.41 lakh in 2001-02 to 0.57 lakh in 2010-11. This may be due to the closure of number of composite mills in the country. However, the number of looms in the unorganised sector increased from 16.66 lakh to 22.61 lakh during the same period. The installed capacity for man-made fibre has increased from 1090 million kg in 2001-02 to 1763.1 million kg in 2010-11. The CAGR is 5.49% and the installed capacity for man-made filament has gone up from 1135 million kg to 2188.2 million kg with 7.57% CAGR.
Number of Spinning & Weaving Mills The number of spinning & weaving mills during the last one decade can be seen as below:
| Description | 2001-02 | 2010-11 | CAGR % |
| Spinning Unit (Non Small Scale Industry) | 1579 | 1713 | 0.64 |
| Composite Units | 281 | 183 | -4.66 |
| Exclusive Weaving Units (Non Small Scale Industry) | 207 | 183 | -1.36 |
| Spinning Units (Small Scale Industry) | 1046 | 1299 | 2.44 |
| Power Loom (Lakhs) | 16.66 | 22.61 | 3.45 |
| Hand Loom (Lakhs) | 38.91 | 23.77 | -5.33 |
It can be seen from the above that the number of spinning units both (non SSI) as well as SSI show increasing trends. Composite mill numbers have declined from 281 in 2001-02 & 183 in 2010-11, a decline by 4.66%. The numbers of powerlooms have gone up from 16.66 lakh & 22.61 lakh with CAGR of 3.45% while in case of handlooms the numbers have declined from 38.91 lakh in 2001-02 & 23.77 lakh in 2010-11, a decline by 5.33%. Thus, the organised mill sector shows a declining trend while the unorganised powerloom sector shows an increasing trend.
Trends in Fibre & Yarn Production* It can be seen from the below analysis, that there is all-round improvement in the production of man-made fibres as well as yarn.
| Description | 2001-02 | 2010-11 | CAGR % |
| Man-Made Fibres | 834 | 1268 | 5.38 |
| Man-Made Filament Yarn | 962 | 1522 | 5.90 |
| Total Spun Yarn | 3101 | 4193 | 3.84 |
| (a) Cotton | 2212 | 3079 | 4.22 |
| (b) Blended and Non-cotton | 889 | 1114 | 2.86 |
In Million kgs
Sector-wise Cloth Production* The sector-wise cloth production over the period can be seen from the following table.
| Sector | 2001-02 | 2009-10 | CAGR % |
| Mill Sector | 1546 | 2016 | 3.37% |
| Hand Loom | 7585 | 6806 | -1.35% |
| Power Loom | 25192 | 36997 | 4.92% |
| Hosiery | 7067 | 13702 | 8.63% |
| Khadi & Wool & Silk | 714 | 812 | 3.22% |
| Total Cloth Production | 41390 | 60333 | 4.51 |
In Million Sq. Mtr.
It can be seen that the total cloth production registered an increase of 4.51% during 2001-02 to 2009-10. The highest growth rate is in the hosiery sector (8.63%) followed by powerloom sector (4.92%), Mill sector (3.37%) & khadi & wool & silk (3.22%). Handloom sector witnessed a marginal decline in the cloth production from 7,585 million sq. mtr. in 2001 to 6,806 million sq. mtr. in 2010.
Sectoral Composition in Cloth Production The composition of cloth production can be seen as below:
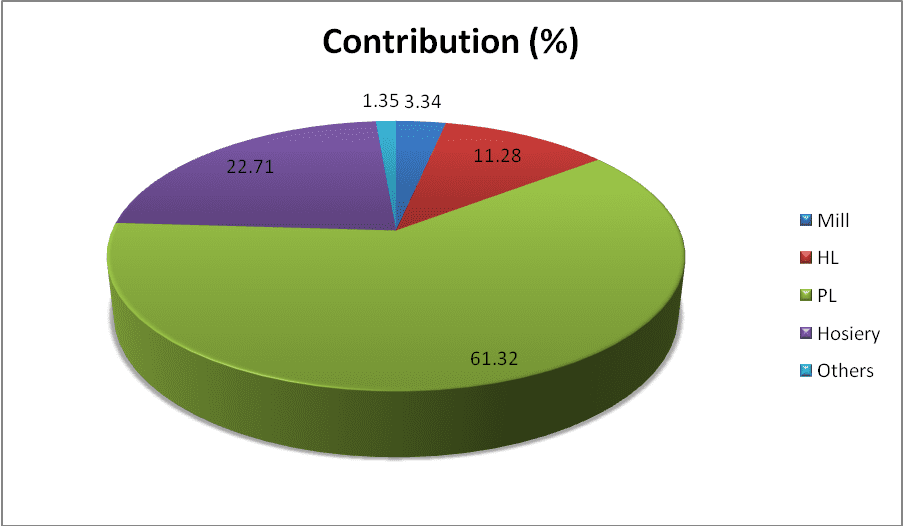
It can be seen that the organised sector (Mill Sector) contributes only 3.34% of fabric production & the remaining 96.66% fabric is being produced by the unorganised sector. Powerloom sector contributes maximum fabric production at 61.32%, followed by hosiery sector at 22.71% and handloom sector at 11.28%.
Cotton/ Blended/ Non-cotton Cloth Production* The production of cotton cloth, blended cloth & non cotton cloth can be seen as below:
| Fibre | 2004-05 | 2010-11 |
| Cotton | 20655
(46.23) |
31742
(51.43) |
| Blended | 6032
(13.49) |
8278
(13.41) |
| Non-cotton | 17998
(40.28) |
21710
(35.16) |
| Total | 44685
(100) |
61730
(100) |
(*In Million Sq. Mtr. Figures in brackets represent percentage to total)

It can be seen that the total cloth production which was 44,685 million sq mtr. in 2004-05 increased to 61730 million sq mtr. in 2010-11. Cotton cloth production which was 20,655 million increased to 31742 million sq mtr. Its percentage share increased from 46.23 to 51.43%. Blended cloth production increased from 6032 million sq mtr. to 8278 million sq mtr. Its percentage share has remained at 13%. In the case of non cotton cloth production, it has increased from 17998 million sq. mtr. to 21710 million sq. mtr. but its percentage share has decreased from 40.28 to 35.16.
Cloth Production By Mill Sector* The cloth production by mill sector & the composition of cotton, blended & non cotton cloth can be seen as below.
| Fibre | 2004-05 | 2010-11 |
| Cotton | 1072
(70.25) |
1604
(72.75) |
| Blended | 243
(15.93) |
526
(23.85) |
| Non-cotton | 211
(13.82) |
75
(3.40) |
| Total | 1526
(100) |
2205
(100) |
(*In Million Sq. Mtr. Figures in brackets represent percentage to total)
It can be seen that cotton cloth production by mill sector has increased from 1,072 to 1,605. Its share has increased from 70.25% to 72.75%. In the case of blended cloth, the production increased from 243 million sq. mtr. to 526 million sq. mtr., its share has gone up from 15.93% to 23.85%. However, non cotton cloth production by mill sector has decreased from 211 to 75 million sq. mtr. and its percentage share has come down from 13.82% to 3.40%.
Cloth Production by Powerloom Sector* The cloth production by powerloom sector can be seen as below:
| Fibre | 2004-05 | 2010-11 |
| Cotton | 7361
(25.98) |
11852
(31.25) |
| Blended | 4526
(15.97) |
5853
(15.43) |
| Non-cotton | 16438
(58.05) |
20224
(53.32) |
| Total | 28325
(100) |
37929
(100) |
(*In Million Sq. Mtr. Figures in brackets represent percentage to total)
It can be seen from the above that powerloom sector produces maximum non-cotton cloth accounting for 53.32% in production. It is followed by cotton cloth (31.25%) & Blended cloth (15.43%). However the share of non cotton has declined from 58% to 53% & that of cotton has increased from 26% to 31%.
Cloth Production by Handloom Sector * The cloth production by handloom sector can be seen as below:
| Fibre | 2004-05 | 2010-11 |
| Cotton | 4792
(83.75) |
6016
(86.61) |
| Blended | 146
(2.55) |
143
(2.05) |
| Non-cotton | 784
(13.70) |
790
(11.34) |
| Total | 5722
(100) |
6949
(100) |
(*In Million Sq. Mtr. Figures in brackets represent percentage to total)
It can be seen from the table that handloom sector produces cotton cloth 86.61% while the share of non-cotton cloth is 11.34% & that of blended cloth only 2.05%.
Cloth Production By Hosiery Sector The cloth production* by hosiery sector can be seen as below:
| Fibre | 2004-05 | 2010-11 |
| Cotton | 7430 (81.54) | 12270
(83.78) |
| Blended | 1117 / 12.26% | 1756
(11.99) |
| Non-cotton | 565
6.20) |
620
(4.23) |
| Total | 9112
(100) |
14646
(100) |
(*In Million Sq. Mtr. Figures in brackets represent percentage to total)
It can be seen from the table that hosiery sector mainly produces cotton cloth accounting for 83.78% followed blended cloth (11.99%) & NC cloth (4.23%).
Fibre-wise / Sector-wise Comparison A comparison of difference sectors in fibre-wise cloth production over the period can be seen as below in percentage terms.
| Fibre | Mill | Power Loom | Hand Loom | Hosiery | ||||
| 2004-05 | 2010-11 | 2004-05 | 2010-11 | 2004-05 | 2010-11 | 2004-05 | 2010-11 | |
| Cotton | 70.25 | 72.75 | 25.98 | 31.25 | 83.75 | 86.61 | 81.54 | 83.78 |
| Blended | 5.93 | 23.85 | 15.97 | 15.43 | 2.55 | 2.05 | 12.26 | 11.99 |
| Non- Cotton | 13.82 | 3.40 | 58.05 | 53.32 | 13.70 | 11.34 | 6.20 | 4.23 |
| Total | 100 | 100 | 100 | 100 | 100 | 100 | 100 | 100 |
It can be seen that mill, handloom and hosiery sectors mainly produce cotton cloth while powerloom sector mainly produces non-cotton cloth. In all the four sectors, there is an increasing trend of cotton cloth production and decreasing trend of non-cotton cloth production. It indicates that the production of cloth by different sectors have greater similarities than differences even though the end product made from the cloth may differ widely. Thus, the cloth production trend of de-centralised sector reflects the production pattern of the organised sector.