Freudenberg Group
Executive Summary
This report provides insight into the operations of the Freudenberg Group, a technology company specializing in technical textiles, nonwovens, engineered materials, and industrial solutions.
The organization is involved in providing advanced materials and technology in the automobile, healthcare, and energy sectors. This report emphasizes the importance of research, product quality, processes, and customer preferences in the firm’s business model.
In addition, it provides information on how the firm demonstrates environmental responsibility through sustainable production practices. Through expansion into global markets and technological improvement, it has established itself in the technical textile sector.
Company Overview
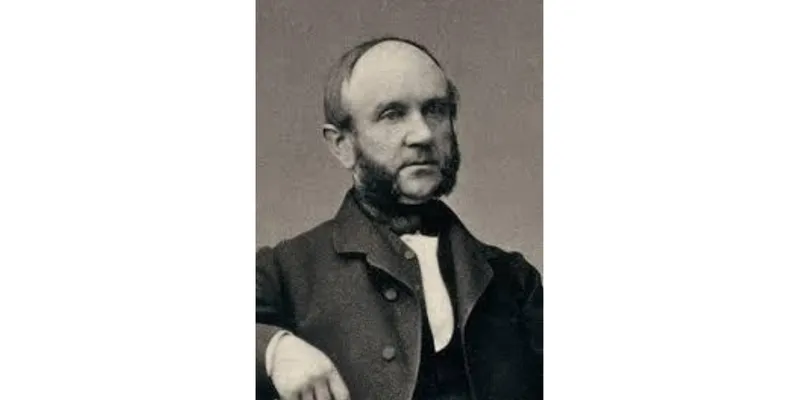
It was founded by Carl Johann Freudenberg in 1849 and is located in Weinheim, Germany. The company has several groups of businesses and has a specialization in the innovation of materials. It performs operations in advanced materials, sealing technologies, vibration control, filtration solutions, technical textiles, specialty chemicals, and performance components.
The company focuses on sustainability, research, innovation, and operations, which helps it become a leading company in the global technical textile industry. Freudenberg has a worldwide presence in almost 60 countries.
Industry Overview
The Freudenberg Group is in the technical textiles industry. Technical textiles are fabrics manufactured for durability or protection. They manufacture products like surgical gowns, seatbelts, parachute fibres, etc., in different industries. It provides advanced textile solutions for medical products, industrial applications, etc.
Growth is seen in the industry due to industrialization and technological advances, along with demand for sustainability. This industry has expanded production in nations like China, India, and Brazil. Growth will continue in research, development, sustainability, and technology to keep their position within the industry.
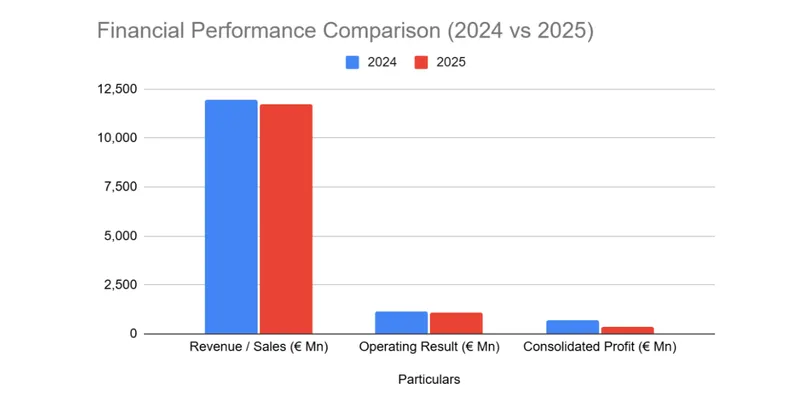
Year | Sales Revenue (€ Million) |
2021 | 10039 |
2022 | 11753 |
2023 | 11903 |
2024 | 11947 |
2025 | 11732 |
Financial Performance Analysis
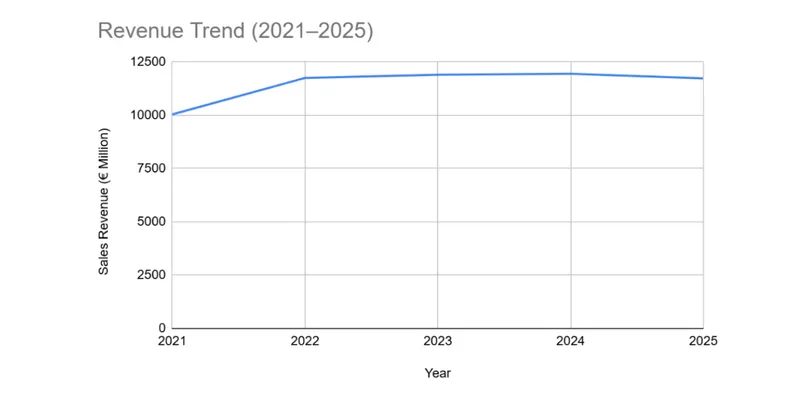
The following table summarizes the financial performance of FY2024 and FY2025.
Particulars | 2024 | 2025 | YoY Change |
Revenue / Sales (€ Mn) | 11,947 | 11,732 | -1.80% |
Operating Result (€ Mn) | 1,132.40 | 1,092.70 | -3.50% |
Consolidated Profit (€ Mn) | 724.8 | 361.9 | -50.10% |
Return on Sales | 9.50% | 9.30% | -0.20% |
Equity Ratio | 56.80% | 57.10% | 0.30% |
R&D Investment (€ Mn) | 604.4 | 579.5 | -4.10% |
Key Financial YOY
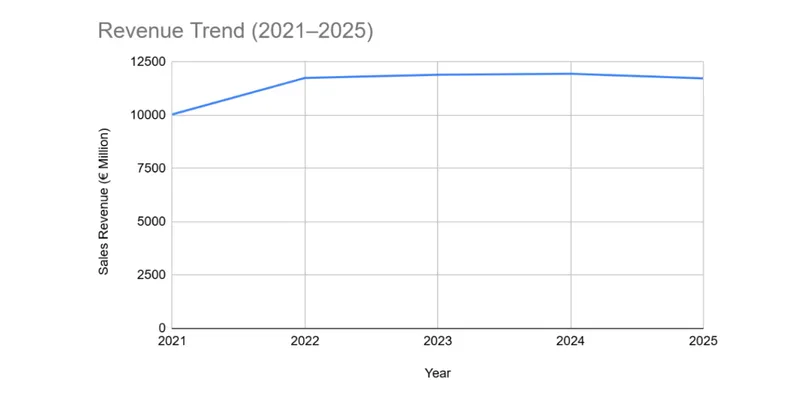
Revenue Trend Over 3–5 Years
Interpretation
The company's revenue decreased in 2025; this is due to a change in the exchange rate and fewer people buying things from industries.
The operating result decreased because of lower sales, an increase in wages, and a change in tariffs.
The company's overall profit decreased. This decrease in profit was caused by the money the company spent on buying companies and the challenges the company faced with its e-Power Systems business.
Even with all these problems, the company is still in a good financial position. The revenue and other parts of the company are stable because they kept putting money into ideas and ways to grow, and this helped them a lot. The company has a lot of money saved up, with 57.1% of its money being its own, which is a good thing.
Key Financial Ratio
Ratio | Formula | Value | Interpretation |
Current Ratio | Current Assets / Current Liabilities | 1.48 | Good short-term liquidity |
Quick Ratio | Current Assets − Inventory / Current Liabilities | 1.04 | Acceptable immediate liquidity |
Gross Margin | Gross Profit / Sales | 29.76% | Healthy gross profitability |
Net Margin | Net Profit / Sales | 3.08% | Net profit declined in 2025 |
ROE | Net Profit / Equity | 4.56% | Lower return due to profit fall |
Debt-to-Equity | Debt / Equity | 0.28 | Moderate leverage |
Interest Coverage | Profit from Operations (EBIT) / Interest Expense | 1.77 times | Lower ability to cover interest |
Inventory Turnover | Cost of Sales / Inventory | 4.59 times | Inventory converted into sales about 4.6 times |
Asset Turnover | Sales / Total Assets | 0.84 times | Assets used reasonably efficiently |
SWOT Analysis
Strengths | Weakness |
|
|
|
|
|
|
Opportunities | Threats |
|
|
|
|
|
|
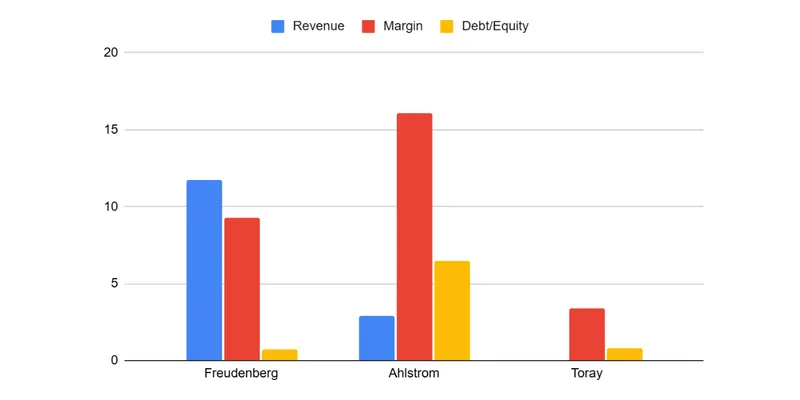
Peer / Competitor Comparison
Company | Revenue | Margin | Debt/Equity |
Freudenberg | 11.73 | 9.3 | 0.75 |
Ahlstrom | 2.93 | 16.1 | 6.46 |
Toray | 17.20* | 3.4 | 0.81 |
Conclusion and Recommendations
The Freudenberg Group is really good at what they do in the textile industry because the company is always coming up with new ideas, they run their business well, and they care about the environment. The company is financially stable. The Freudenberg Group is spending money on research and development projects.
References & Sources
- Freudenberg Group Official Website
- Freudenberg Group Annual Report 2025
- Freudenberg Group Annual Report 2024
- Ahlstrom Official Website
- Toray Industries Official Website
- Google Sheets - Used for creating financial tables, charts, and graphical analysis.